Who is the "leader" in consumption: The demographic cycle changes consumption patterns.
“Are today's young people becoming more and more reluctant to spend money?” —— On social media, similar sighs are endless.
“In middle age, there are mortgage payments, car loans, and children's tuition fees. Which one isn't a money - guzzler?” —— This is the real voice of many breadwinners in families.
“After retirement, will the pension be enough to cover expenses?” —— In an aging society, what exactly is the consumption potential of the silver - haired population?
Chinese people of different age groups are experiencing completely different consumption stories. What seems like individual choices actually hides a grand narrative of demographic structure changes. So, who is the “main force” in the Chinese consumer market? And how is this force shifting quietly?
Judging from the data, the youth group used to be the “main force” in consumption growth, but currently, the growth rate has slowed down due to employment pressure. In the next decade, with the evolution of the population cycle, the middle - aged group may become the main consumption force.
How do the consumption patterns of Chinese people of different ages differ?
Data shows that from 2010 to 2022, the age structure of Chinese people's consumption presented an obvious inverted U - shaped characteristic, that is, the consumption peak occurred between the ages of 30 and 40, and then gradually declined.
So, why is it between the ages of 30 and 40?
On the one hand, major life events occur intensively during this stage. For example, large - scale consumption expenditures such as getting married, buying a house, and purchasing a car mostly happen within this age range.
On the other hand, income reaches its peak. The income of Chinese residents reaches its peak between the ages of 25 and 45. With fatter wallets, people naturally have more confidence to spend money. Data from the United States also confirms this “income - consumption” synchronous curve.
Interestingly, the consumption propensity shows a U - shaped curve with high values at both ends and a low value in the middle.
People between the ages of 30 and 40 often face the dual pressures of mortgage payments and raising children, so their consumption propensity is relatively low. However, their higher income makes up for the shortcoming of low consumption propensity, so they have higher consumption expenditures. In contrast, the elderly have strong demand for medical care and a high willingness to consume, but their income drops significantly after retirement, so their consumption expenditures also decrease accordingly.
This mismatch of “not daring to spend when having money and not having enough money when wanting to spend” leads to the opposite trends of the consumption expenditure curve and the consumption propensity curve.
Who is dragging down consumption growth?
From the perspective of the age distribution of consumers, the population aged 20 - 39 is the current main consumption force.
In 2022, with a population share of 26.7%, they contributed 29.1% of the total consumption, ranking first among all age groups. In contrast, the population aged 40 - 59 accounted for 31%, and their consumption share was 29%, slightly inferior.
The consumption growth of the elderly has “fallen behind”. The proportion of the population aged 60 and above increased from 13.3% in 2010 to 19.9% in 2022, but their consumption share only increased from 12.7% to 18.6%. Insufficient income restricts the “consumption power of the silver - haired population”.
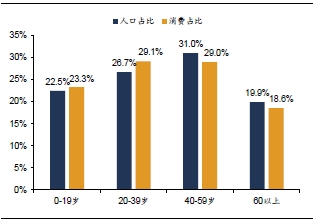
Chart: Proportion of China's population and consumption in 2022. Data source: CFPS, Wind, Research Institute of Soochow Securities
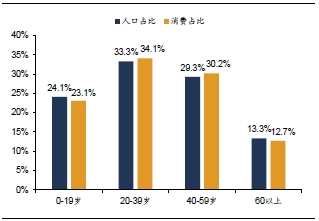
Chart: Proportion of China's population and consumption in 2010. Data source: CFPS, Wind, Research Institute of Soochow Securities
The key turning point occurred in 2018. The group aged 20 - 39 is undergoing a role transformation.
From 2010 to 2018, the population aged 20 - 39 was the primary driving force for consumption growth, contributing 30.3% of the consumption growth. However, from 2018 to 2022, this group became the “main drag” on the decline in consumption growth rate, contributing up to 44% of the decline in the growth rate.
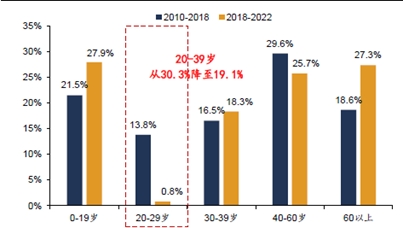
Chart: Contribution of each age group to consumption growth. Data source: CFPS, Research Institute of Soochow Securities
Why has youth consumption stalled? The core problem lies in employment.
In 2022, the unemployment rate of young people aged 16 - 24 was as high as 19.9%, far higher than the overall surveyed unemployment rate of that year, resulting in the break of the “employment → income → consumption” chain. To make matters worse, the average decline in the consumption propensity of the population aged 20 - 39 reached 46.1 percentage points. Young people tightened their wallets and became more conservative in consumption.
How does the new population cycle affect consumption trends?
1. What is the consumption structure of different ages?
According to the demand characteristics of different ages, 7 types of consumption can be divided into the following 3 categories.
The first category of consumption includes clothing, transportation and communication, household equipment and services. The characteristic of this type of consumption is that as age increases, the consumption expenditure generally shows an “inverted U - shape”, and the peak occurs between the ages of 20 and 39. This type of consumption depends on the young population, and aging will directly impact the total amount of this type of consumption.
The second category of consumption includes cultural, educational and entertainment expenditures and housing expenditures. The characteristic of this type of consumption is that after reaching the peak, the consumption does not simply increase or decrease monotonically. Cultural, educational and entertainment expenditures show a “double - peak” characteristic. Students aged 15 - 19 and parents of children aged 40 - 44 are at the peaks. Supplementary teaching materials, interest classes, and parents' educational investment are the driving forces behind this. Housing expenditures start to rise when people aged 20 - 24 first enter the workplace and rent a house, reach the peak when they become the main group of renters between the ages of 25 and 29, and fluctuate after the age of 50 due to the depreciation of self - owned housing.
The third category is food and medical and health care expenditures. The characteristic of this type of consumption is that the consumption expenditure is relatively high in the second half of life. Food consumption shows a characteristic of “high at both ends and low in the middle”. Children and the elderly spend the most. Medical and health care expenditures generally show a U - shape, increasing continuously with age after adulthood and may slow down after the age of 80 due to income decline.
2. The “hump” of consumption shifts to the right, and middle - aged consumption becomes increasingly important
The future consumption trend is that the “hump” of consumption shifts to the right, changing from being dominated by the young and middle - aged to the rise of the middle - aged.
In the past few decades, affected by industrial changes and inter - generational educational differences, the age of peak income in China has gradually shifted to the left from 55 years old in the 1980s to 25 - 29 years old in 2022, driving the consumption peak to shift to the left from 40 - 50 years old to 25 - 29 years old, and the youth has become a driving force for consumption.
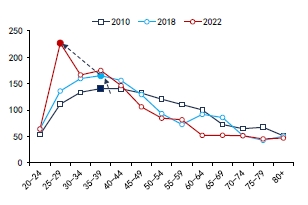
Chart: The “left - shift of the hump” of residents' income from 2010 to 2022. Data source: CFPS, Research Institute of Soochow Securities; Note: The average income of each age group = 100
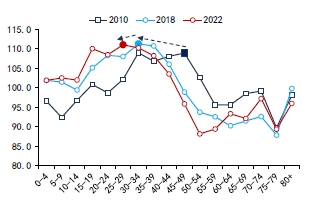
Chart: The “left - shift of the hump” of residents' consumption from 2010 to 2022. Data source: CFPS, Research Institute of Soochow Securities; Note: The average income of each age group = 100
Referring to the experience of South Korea, as the inter - generational educational gap narrows and the value of work experience increases, the peak income will shift towards the middle - aged. It is estimated that by 2035, the age of the highest income in China will shift to the right from the current 25 - 29 years old to 45 - 50 years old, and the consumption peak will also shift to the right to 40 - 54 years old. The middle - aged group will dominate consumption.
3. Consumption trends under population iteration
From 2010 to 2022, the proportion of the population aged 40 - 59 increased, and the population peak shifted to the right due to aging, but the consumption peak shifted to the left. The mismatch between the two restricted the growth of the total consumption.
From 2025 to 2035, the proportion of the population aged 40 - 49 will increase from 13.8% in 2025 to 15.9% in 2030. If the consumption peak shifts to the right synchronously, the overlap of the population and consumption peaks will promote the increase of the growth rate of the total consumption. Assuming other factors remain unchanged, the consumption propensity may increase from 65% in 2020 to 81.6% in 2035, and aging itself will also enhance the overall willingness to consume.
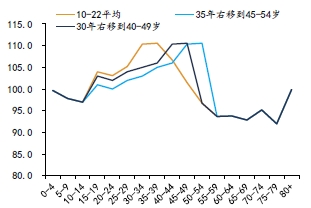
Chart: Hypothetical situation of the right - shift of consumption. Data source: Wind, Research Institute of Soochow Securities; Note: (1) The average consumption expenditure from 2010 to 2022 = 100; (2) Control the average expenditure of each age group under the two right - shift assumptions to be 100, that is, assume that the per - capita consumption expenditure remains unchanged
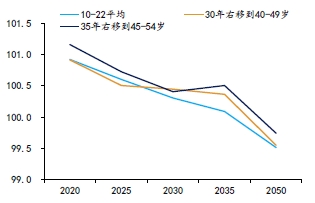
Chart: Changes in consumption expenditure corresponding to the right - shift of consumption. Data source: UN, CFPS, Research Institute of Soochow Securities; Note: The average consumption expenditure from 2010 to 2022 = 100, consumption expenditure = Σ (population weight of age group i * consumption expenditure of age group i)
The change in the population structure drives the consumption structure to show the characteristics of “growing essential consumption of the elderly, periodic explosion of educational demand, and the rise of the middle - aged as the main consumption group”.
The proportion of food and medical and health care expenditures, in which the elderly have a relatively high consumption share, will become higher and higher in the overall social consumption structure.
Cultural, educational and entertainment consumption will achieve periodic growth. From 2025 to 2030, the proportion of the population aged 15 - 24 and 40 - 49 will increase, roughly corresponding to high - school to university students and parents in the peak period of children's education demand, which will drive up cultural, educational and entertainment expenditures, especially in the fields of supplementary teaching materials, vocational training, and cultural consumption.
Youth - dominated consumption still has local opportunities. From 2030 to 2035, the proportion of the population aged 20 - 29 who are just entering the workplace and the middle - aged consumption group aged 45 - 54 will increase. Although the total number of young people is decreasing, there is still room for growth in consumption areas such as renting a house, workplace clothing, commuting, and purchasing furniture among the age group with a consumption peak between 20 and 29 years old.
The most core change is the “change of generations” of the main consumption force. The main consumption group is shifting from the “youth” to the “middle - aged and elderly”, and the main consumption force will shift from “under 40 years old” to “over 40 years old”. It is estimated that by 2035, the consumption share of the population over 40 years old will reach 60.2%, becoming the main consumption force.
It should be emphasized that although the age structure is changing, the generational attributes of the main consumption group remain stable, still mainly composed of the “post - 70s”, “post - 80s”, and “post - 90s”. Their consumption preferences after entering middle age, such as health, education, and family services, will dominate the market, rather than the younger “post - 00s” and “post - 10s”.
* The original text is from the report “Who is the ‘leader’ in consumption: The population cycle changes the consumption model” by Soochow Securities
The content of this article is organized by AI and does not represent the author's views.
