From the red-hot boom to the collapsing spiral, the lessons and enlightenment of the "A-shaped market trend" in the optical fiber industry
In the first half of the "A-shaped market trend" in the optical fiber industry, there was a nearly unassailable logic for price increases.
At its peak, the rise of the optical fiber industry was backed by a very complete narrative: AI brought massive new demand, drones opened up a second blue ocean market; expanding optical preform production capacity took 18 to 24 months, North American cloud vendors locked in orders worth tens of billions of dollars or even took direct equity stakes, leading to long-term tight supply and demand.
The sudden explosion of AI demand pushed the industry to operate at a high utilization rate, the supply elasticity was compressed to an extremely low level, and prices skyrocketed accordingly; and the price itself in turn became the most powerful catalyst for the market rally.
The spot price of G.652.D bare fiber rose from 31.5 RMB per core-kilometer at the end of 2025 to 85.7 RMB in August 2026, and the spot price range in September further expanded to 85 to 120 RMB. Calculated based on the industry low of about 20 RMB in 2025, the increase exceeded 300%.
Structurally benefited varieties rose even more sharply. The price of G.657.A2 rose from 32 RMB in 2025 to 200 to 240 RMB in mid-2026, an increase of 525% to 650%.
Therefore, multiple-bagger stocks emerged frequently, and it seemed that the core logic was as solid as it could be.
However, in less than a year, the optical fiber industry completed its vigorous A-shaped market trend, from the endless emergence of multiple-bagger stocks to the index falling by more than half, and now it has entered an endless platform adjustment period.
01
The first half of the A-shaped market trend: a nearly unassailable price increase narrative
1. First look at the demand side
The driving force of AI on optical fiber is very strong, which can be divided into three layers: high-density Scale-up connections in cabinets, large-core-count Scale-out wiring between cabinets, and long-distance interconnection across data center DCI.
The number of optical fiber connections per cabinet in traditional general data centers is about 40 to 80 cores, while that in AI data centers is about 800 to 1000 cores, with a usage increase of about 15 times; the network architecture has changed from three layers to two layers of Spine-Leaf, the convergence ratio has changed from 3:1 to 1:1, and all-optical interconnection has become the default solution.
A typical 10,000-card GPU cluster requires tens of thousands of core-kilometers of optical fiber only for interconnection inside servers.
Industry research data also matches this. In 2025, the global data center optical fiber demand reached 69.6 million core-kilometers, a year-on-year increase of 75.9%, accounting for about 10% of the global total; it is estimated to reach 91.6 million core-kilometers in 2026, a year-on-year increase of 32%; Yangtze Optical Fibre and Cable cited CRU data in its 2026 interim report stating that the year-on-year growth rate of data center-related optical fiber demand in 2026 reached 69%, which has become the main source of industry growth.
Another set of brokerage calculation standards is more intuitive: the global data center optical fiber usage increases from 75 million core-kilometers in 2025 to 132 million in 2026 and 244 million in 2027, and its proportion in the total global demand rises from 12.6% to 27.4%. AI-related optical fiber accounted for less than 5% of global demand in 2024, and is expected to rise to 35% by 2027.
If we further extrapolate, the proportion of data center demand in optical fiber will directly reach half in the future. In short, the data center will recreate an entire optical fiber market.

Figure: Estimation of global data center optical fiber and cable usage Source: CRU, Huatai Securities
Drones form the second growth curve. The global drone optical fiber demand was about 50 million core-kilometers in 2025, and it is expected to exceed 100 million in 2026, but the overall driving effect is far less than that of data centers.
At the same time, the product structure is also upgrading. Data centers widely use G.657.A1/A2 bend-insensitive optical fiber, OM5 multimode optical fiber, G.654.E ultra-low loss optical fiber, whose unit price is significantly higher than ordinary G.652.D. This means that the driving effect of data centers on revenue is faster than that on core-kilometer volume — the gross profit margin of Yangtze Optical Fibre and Cable's optical transmission division can reach 63%, which is the reason behind it.
Therefore, according to the calculation of Research and Markets, the global optical fiber and cable market size will exceed 150 billion US dollars by 2033, which is more than double the historical average.
2. Then look at the supply side
As a mature industry, the optical fiber industrial chain is not that complicated. It can be divided into three segments: optical preform, optical fiber, and optical cable: the optical preform is drawn into optical fiber, and the optical fiber is then cabled. The real bottleneck restricting capacity expansion is the upstream optical preform. Optical preforms account for about 70% of the cost of optical fiber, and are recognized as the segment with the highest barriers in the industrial chain.
The manufacture of optical preforms relies on high-purity quartz glass, silicon tetrachloride, germanium tetrachloride, hydrogen and helium, and is prepared through chemical deposition and sintering processes such as MCVD, PCVD, OVD, VAD. Most of the equipment is customized (leading companies even produce it by themselves), and it needs to be supported by clean rooms and gas supply systems. Corrosive gas flows through the reaction pipeline. Once production is stopped, the pipeline is easy to be scrapped and needs to be replaced.
Environmental approval, equipment delivery, plant infrastructure, installation and commissioning, process verification and yield ramp-up take 18 to 24 months in the whole process, which is similar to the expansion cycle of general semiconductor factories.
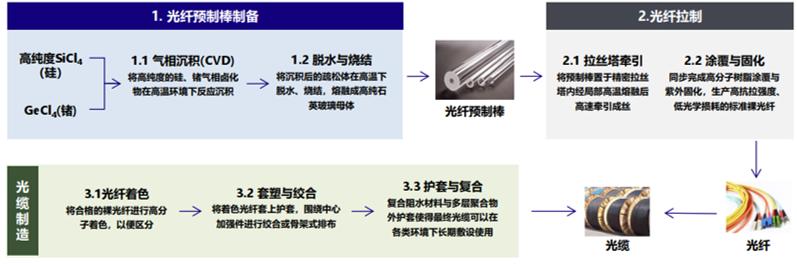
Figure: Optical fiber production process
As an industry that has achieved domestic breakthroughs, the market believes that Chinese manufacturers have greater opportunities. Because high-end production lines are mostly used for multimode and hollow-core optical fibers and have been locked, the capacity expansion cycle in Japan and India is longer. The consensus expectation is that the world will be highly dependent on China's optical preform and optical fiber capacity expansion in the short term.
3. Heavy bets from AI leaders add fuel to the supply and demand narrative
The change in customer structure is the most touching part of this round of narrative.
In January 2026, Meta reached a multi-year long-term optical fiber agreement with Corning with a maximum value of 6 billion US dollars; in May, Nvidia invested up to 3.2 billion US dollars in Corning, including 500 million US dollars in pre-financing warrants and 2.7 billion US dollars in common stock subscription, promoting its US optical connection production capacity to increase by 10 times and optical fiber production capacity by more than 50%; on June 8, Amazon signed another multi-year agreement worth billions of dollars with Corning...
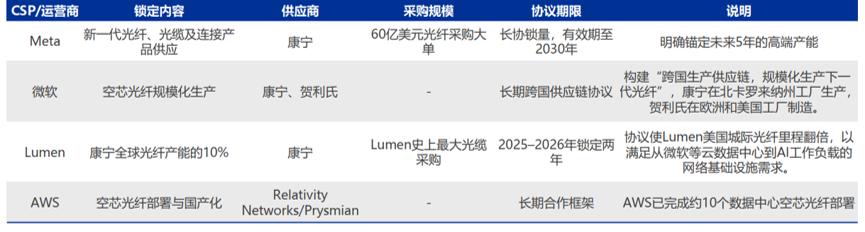
Figure: Bets of North American leading enterprises on optical fiber Source: Shenwan Hongyuan Securities
These three long-term agreements have changed the pricing mechanism of the optical fiber industry. In the past, optical fiber was a standardized product for operator centralized procurement, and the price was determined by bidding; now North American cloud vendors directly lock in production capacity, and the price is determined by scarcity. What is even more exciting is that buyers have changed from operators who are extremely sensitive to prices to tech giants who are more sensitive to delivery timeliness and performance, and are more capable of paying.
At this point, everyone decided to completely get rid of the historical burden that the optical fiber industry is a cyclical industry.
The market's narrative for optical fiber was sublimated: the core of demand shifted from connecting people and devices to connecting computing power and data; the product structure was upgraded from homogenization to specialization and high-end; North American cloud vendors have sufficient capital expenditure, and the price transmission capacity and profit quality are expected to improve.
Based on this, it is judged that the optical fiber industry will change from a cyclical industry to a money-printing industry. Whether it is a leading company or a second-tier company, as long as it is related to the concept, its stock price can take off immediately.
02
The second half of the A-shaped market trend: the narrative moves towards a reverse collapse spiral
1. On the surface, intensive capacity expansion announcements broke the narrative
Everyone has witnessed the subsequent tragic pullback. At the very beginning, when the old industry players expanded production, everyone could still interpret it as good news — Chinese enterprises have great production capacity elasticity, and capacity expansion means seizing market share, until cross-border players announced their entry into the optical preform sector, all logic moved towards a reverse spiral.
For example, Han's Laser plans to invest 2.52 billion RMB in Zhangjiagang to build an optical preform project. The first phase and the second phase will form preform production capacity of 1200 tons and 800 tons respectively, corresponding to 36 million and 24 million core-kilometers of optical fiber production capacity, and be compatible with hollow-core optical fiber.
When a laser equipment enterprise is willing to invest 2.5 billion RMB to enter the optical preform sector, it shows that the profit margin of this link is high enough to attract outsiders, and the technical threshold is not as high as described in the narrative.
In history, when cross-border players flood into the industry, it is often not far from the peak of prosperity. In fact, before that, the list of optical fiber capacity expansion had already been very long.
Far East Smart Energy will add 1800 tons of new capacity, FiberHome plans to add 1300 tons, Hengtong Optic-Electric's second phase adds 800 tons, and Zhongtian Technology and Tefa Information also have capacity expansion plans. Against the background that the market index has already halved, on September 24, Hengtong still released a fixed increase plan of no more than 6.636 billion RMB, of which 3.148 billion RMB is invested in optical communication, including 800 tons/year optical preform, 6 million core-kilometers/year optical fiber, hollow-core/few-core/polarization-maintaining optical fiber and FAU production capacity.
The total of the three clear projects of Far East, FiberHome and Hengtong is 3900 tons. Converted according to the general industry standard of 35,000 core-kilometers per ton, it corresponds to about 137 million core-kilometers of drawing capacity. This just covers the 82 million core-kilometer gap in 2027, and there is still remaining capacity.
A simple calculation will show that it is difficult for the industry to maintain a sustained hard gap. Adding up all public projects, China's new optical preform production capacity is about 14,700 tons, equivalent to 515 million core-kilometers of optical fiber, which is 110% of the current theoretical production capacity, and the effective supply will be concentrated from the second half of 2027 to 2028.
So the future timeline is very clear: in the next two years when the gap still exists, the price can be maintained; in the two years when the supply lands, it is difficult for the price not to move down to find a new equilibrium point.
The reason why the market reacted so violently is that it immediately found a familiar template: photovoltaic/silicon material. The same path of "demand explosion — price increase — capacity expansion — overcapacity — price collapse" just happened to silicon materials in 2021-2023.
2. The hidden line: pattern determines how long excess profits can last — the so-called moat
As mentioned above, the market is used to describing optical preforms as a "choke point link". This statement was valid ten years ago, but now we can easily find three counterexamples.
Counterexample 1: The technology has been broken through, and the technical generation gap of high-end products is narrowing.
The overall localization rate of China's optical preforms has exceeded 80%. For example, the leading company Yangtze Optical Fibre and Cable is the only enterprise in the world that has mastered the three mainstream processes of PCVD, OVD and VAD at the same time and achieved large-scale industrialization. Domestic manufacturers are also rapidly catching up in high-end special optical fibers. G.657 and G.654.E have been mass-produced, and hollow-core and few-core optical fibers are also under layout.
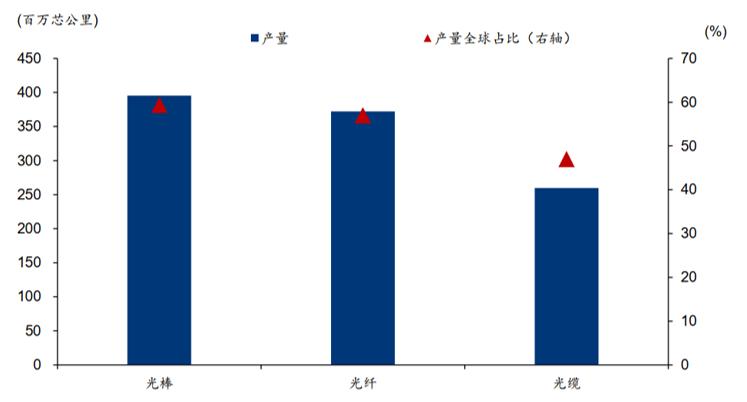
Figure: China's domestic output of optical preforms, optical fibers and optical cables and their global proportion in 2025 Source: CRU, Huatai Securities
Counterexample 2: Equipment investment is actually not expensive.
The domestically produced optical preform equipment independently developed by Yangtze Optical Fibre and Cable has reduced the cost of a single set from 3 million euros to less than 3 million RMB. Equipment priced at 3 million RMB per set cannot constitute a capital barrier. What really stops people is the commissioning cycle and yield ramp-up, which can be solved by time and money.
Counterexample 3: The whole industry suffered losses in the last round. If barriers could really protect profits, the optical fiber price would not have fallen to around 30 RMB per core-kilometer from 2023 to 2025, and the profits of the four major manufacturers would not have been at a very low level. Manufacturers with barriers still lose money, because optical preforms are standard products, and the price of standard products is determined by marginal supply, not by technology. This is the most powerful evidence that "high barriers do not equal high pricing power".
Even if you don't understand the industry's history, technical details and investment intensity, the most straightforward method is to count the number of players. There are enterprises with optical preform know-how and large-scale manufacturing capabilities around the world: overseas there are Corning, Furukawa, Fujikura and Sumitomo, domestic there are Yangtze Optical Fibre and Cable, Zhongtian Technology, FiberHome, plus a number of second-tier manufacturers and cross-border players who are entering the market. This list is actually not short.
From the share data, we can also see that no one has opened an essential gap with others.