The most stringent wet experiment prediction benchmark in history has been released: even with inference fully saturated and computing power increased fivefold, it is still in vain.
Wait, have today's benchmarks evolved to this level???
This time there's no rote memorization of test questions: you just give AI a set of experimental conditions, and let it conduct research on its own and predict the results of real wet experiments in advance……
For example, changing several conditions for the same reaction, which one can produce more target products? For a batch of antibody variants, which one has higher expression level?
Keep the answers hidden first, wait for AI to submit its results, then compare them with the actual measured data.
You know what, this test is really worth running right now.
In the past two years, the AI for Science approach has gone deeper and deeper: AI can already independently look up literature, use professional software, and work continuously for hours to complete an analysis task without any difficulty.
Naturally, everyone is moving to the next stage: What kind of scientific research capabilities do we ultimately want AI to have?
Wet experiment result prediction is one of the capabilities with considerable practical value.
It requires AI to understand the experimental objectives, and dig out relevant mechanisms from existing knowledge, so as to better help researchers filter research directions worthy of further exploration.
The new benchmark Science Prediction Universe (abbreviated as SPU), led by UniPat AI, has keenly captured this point.
116 tasks, 4207 wet experiments, covering chemistry, materials science, biology and medicine. The benchmark consultants and wet experiment cooperation members also come from universities including Stanford, Cornell, Harvard, as well as cutting-edge domestic scientific research institutions and biotechnology companies.
The model is required to work 8 hours per session, equipped with one H20 GPU, and independently decides how to use retrieval and computing resources to generate experimental predictions.
The result is beyond everyone's expectation.
Even top models like Opus 5.5 and GPT-6 Astra are still far away from achieving truly reliable prediction in terms of data performance...
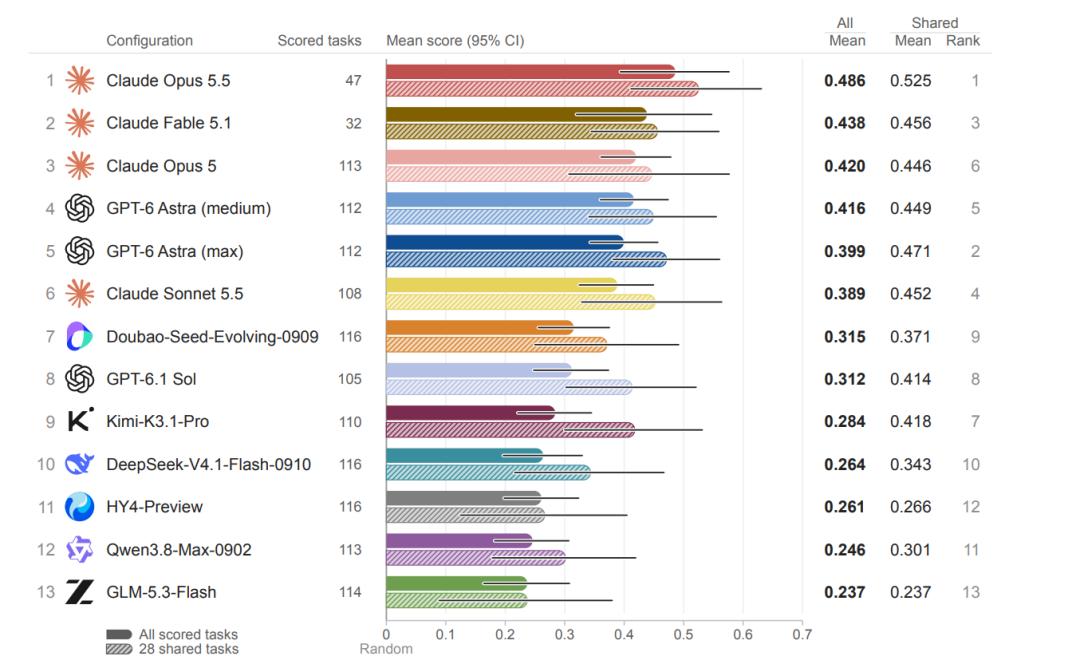
△Average scores of all configurations across all scored tasks
It has to be said that SPU sets a very tough challenge for all scientific research models.
Those previously intangible scientific research capabilities can now be uniformly evaluated and quantified for continuous research.
As for how AI's scientific research judgment is gradually formed, we now have a more specific basis for discussion.
Wet Experiment Prediction: A Special Exam for Models
Back to wet experiment prediction, first of all, this is definitely not a new topic.
There have been many such moments in the history of science: a judgment is made before the experiment, then left to the process to verify. If it is correct, it is retained; if it is wrong, it is overturned.
The specific judgment logic constitutes the scientist's taste.
With good enough taste and accurate enough intuition, scientists can get major results faster while saving precious experimental resources.
After all, for a single wet experiment, chemists need to prepare reagents, set reaction conditions, and then separate products; biologists also need to go through lengthy protein expression processes... The time cost and tool cost themselves are very high, and if the results are not ideal, you have to repeat the process for several rounds.
Therefore, making predictions before starting the experiment is the most valuable step in the scientific research workflow.

The only difference is that in the past this work relied entirely on scientists themselves. Now in the AI era, models also need to have this capability, and there needs to be a test paper that can score for this capability.
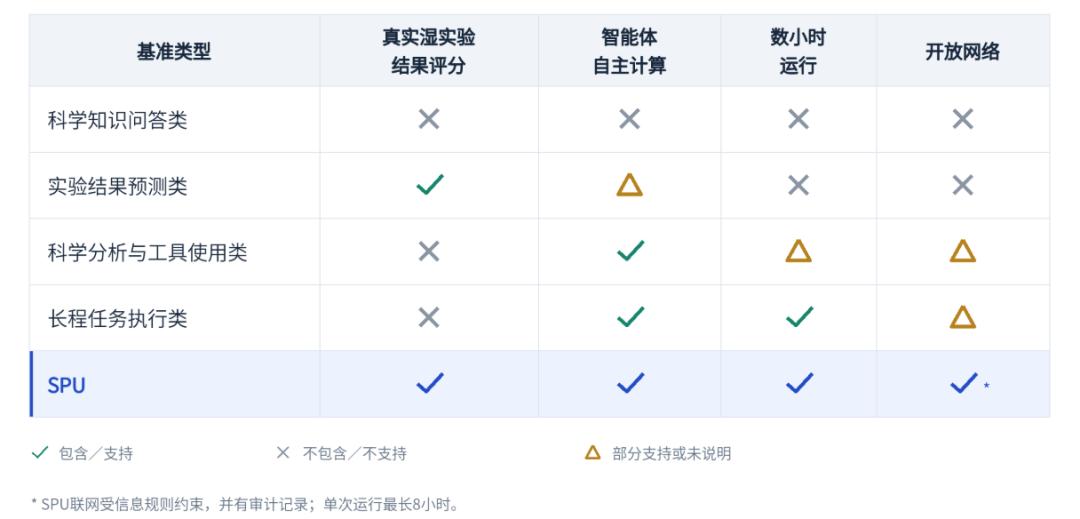
Existing benchmarks cannot fully cover this scenario: for example, BrainBench asks models to directly judge experimental results, ScienceAgentBench focuses on completing analysis based on existing data, and long-range task benchmarks such as Terminal-Bench 4.0 and Long-Horizon-TB mainly use preset tests to check task outputs.
SPU is different from all of them.
It emphasizes testing AI's independent research process and wet experiment result prediction together, covering not only prediction performance, but also the ability to use scientific tools and execute long-range tasks.
△Chart generated by AI
SPU organizes these judgments into clear tasks.
100 public tasks are selected from 85 recently published papers. Domain experts sort out candidate options, materials, conditions and measurement methods from the research, and retain complete quantitative results as the scoring basis.
The other 16 private tasks come from four groups of unpublished collaborative wet experiments, involving VHH nanobodies, reaction conditions, electrolytes and Magrolimab variants.
There are a total of 32 sub-fields and 4207 experiments. Public research provides interdisciplinary task sources, and the actual measured results are hidden from the model, while unpublished experiments add verification independent of answers in public papers.
To a certain extent, this can prevent the model from seeing the test questions in advance.
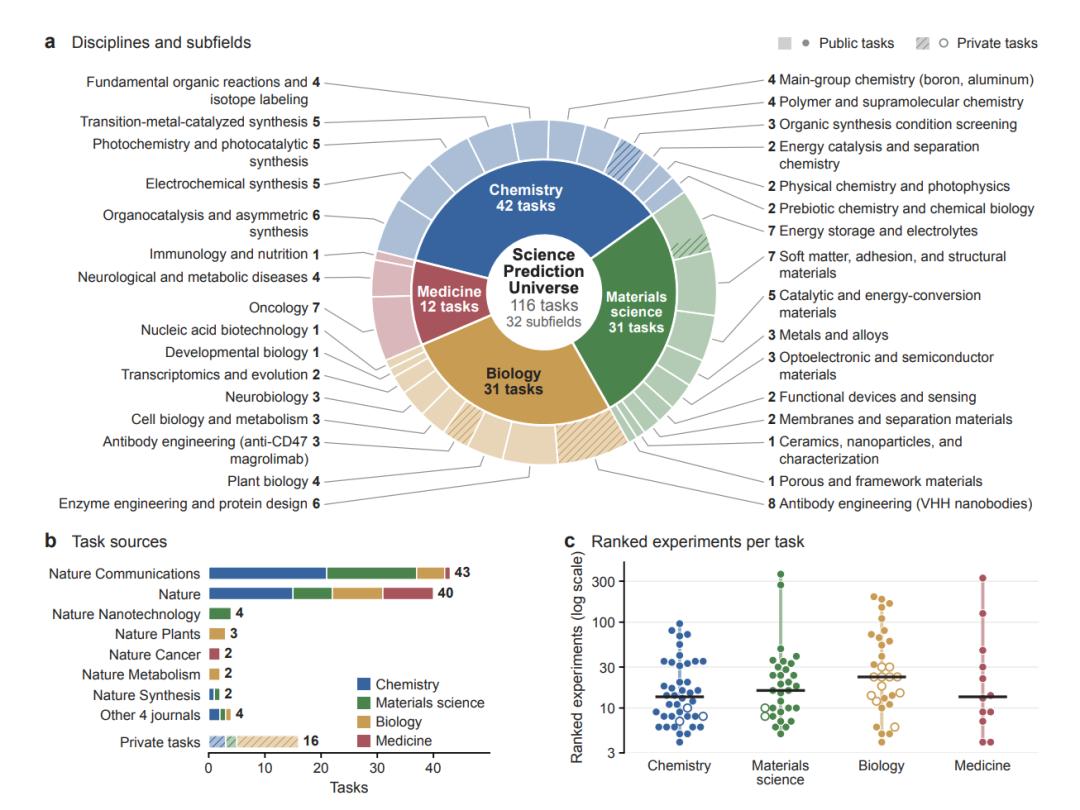
△Task coverage and sources of SPU
The screening process of test questions is also very meticulous.
Experts prioritize studies with complete measurements and clear conditions. Simple problems that can be sorted along a single trend will be directly eliminated, and problems with too close numerical values will also be regarded as having little reference value.
The questions left in the end are more difficult and more discriminative.
During the specific prediction process, the model is required to run for eight hours each time, with 8-core CPU, 16 GiB memory and one H20 GPU, while allowing Internet retrieval and installation of scientific research software.
During this period, the model will collect evidence on its own, select calculation methods, and finally submit the prediction ranking of each comparison group from low to high.
In order to prevent memory contamination, the entire scoring process is carried out in an independent, disconnected container, AI is prohibited from retrieving original research results, and the system will automatically scan tool outputs to identify identifiers such as DOI and title of the source paper.
Finally, the system uses the Spearman correlation coefficient to compare the prediction ranking with the actual measured ranking.
The closer the coefficient is to 1, the closer the ranking is to the experimental results.
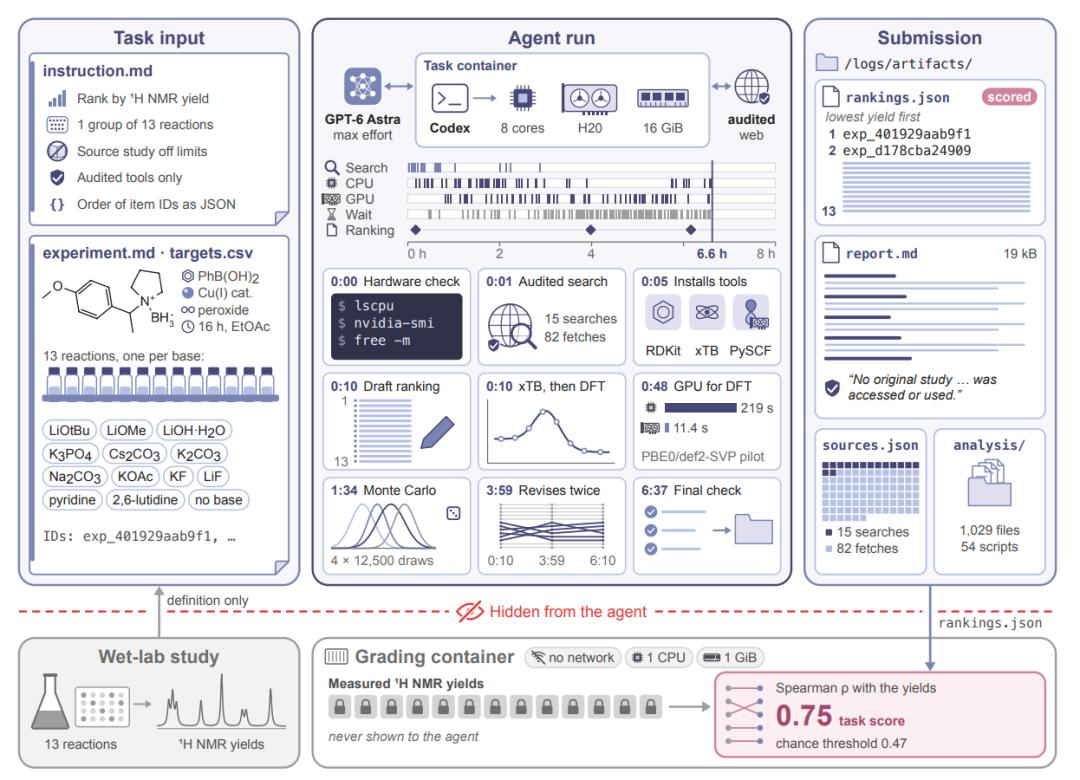
△Evaluation process of SPU
Interestingly, SPU also pays attention to many details that other benchmarks have not considered.
For example, for the final score, SPU will consider whether it is just luck, what if the model gets the correct answer by sheer coincidence?
Therefore, it will additionally generate 4000 random rankings for each question, take the 95th percentile as the random level threshold, and check whether the model's submission significantly exceeds this reference. Different tasks also have corresponding reference standards.
The entire SPU design can be described as scientifically rigorous.
The model has to judge step by step on its own what is worth calculating, and submit its final prediction.
This design not only helps measure the current AI's wet experiment prediction capability, but also points out the direction for subsequent research teams to continuously improve experiments with unified indicators.
Anyway, let's take a look at the report cards of the first batch of cutting-edge models. The details are quite worth explaining separately.
New Test Makes Cutting-edge Models Perform Poorly Collectively
The first round of systematic evaluation of SPU covers 12 cutting-edge models and 13 configurations. The configuration here refers to the model, inference intensity and the model framework used.
Let's talk about the overall performance first.
In one sentence: None of them perform very well.
Among all scored tasks, the highest average score is obtained by Claude Opus 5.5, with 0.486 points. But only half of the tasks exceed the random level.
Among the 13 configurations, almost all of them are like this: the proportion of tasks that can exceed the random level threshold is only 34%~52%.
That means all the models present are still a long way from truly reliable wet experiment prediction.
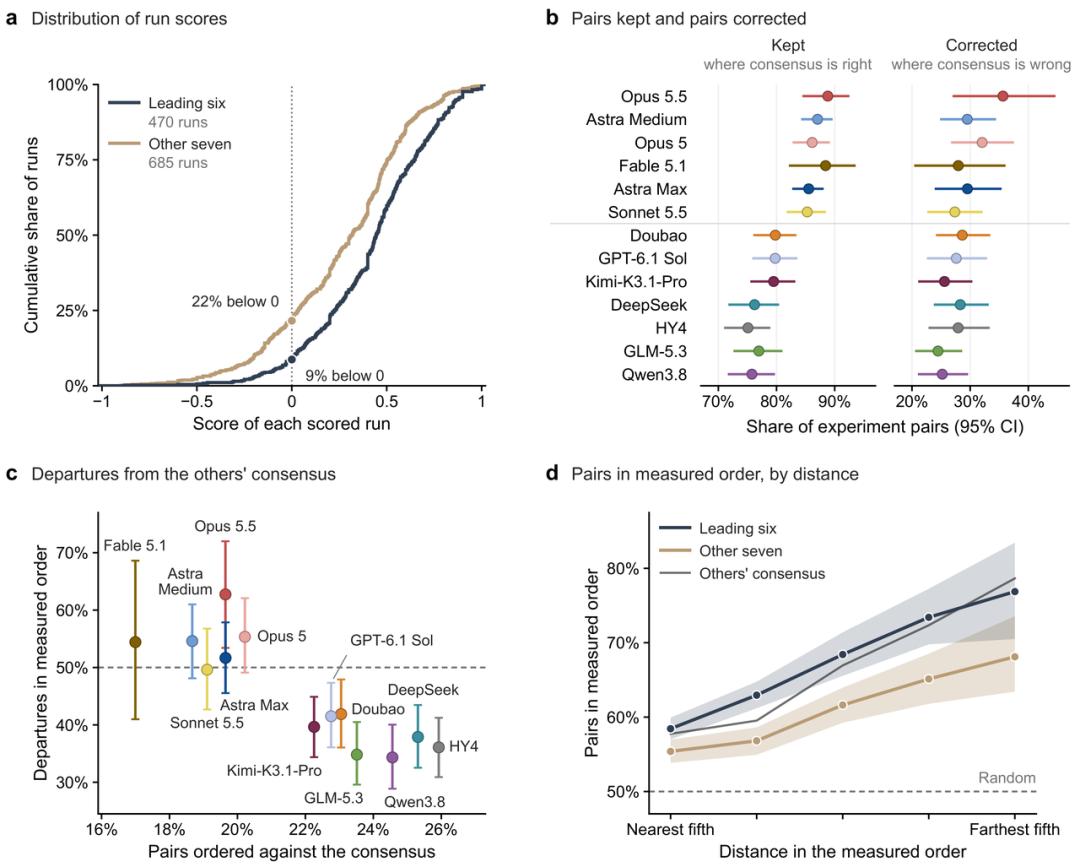
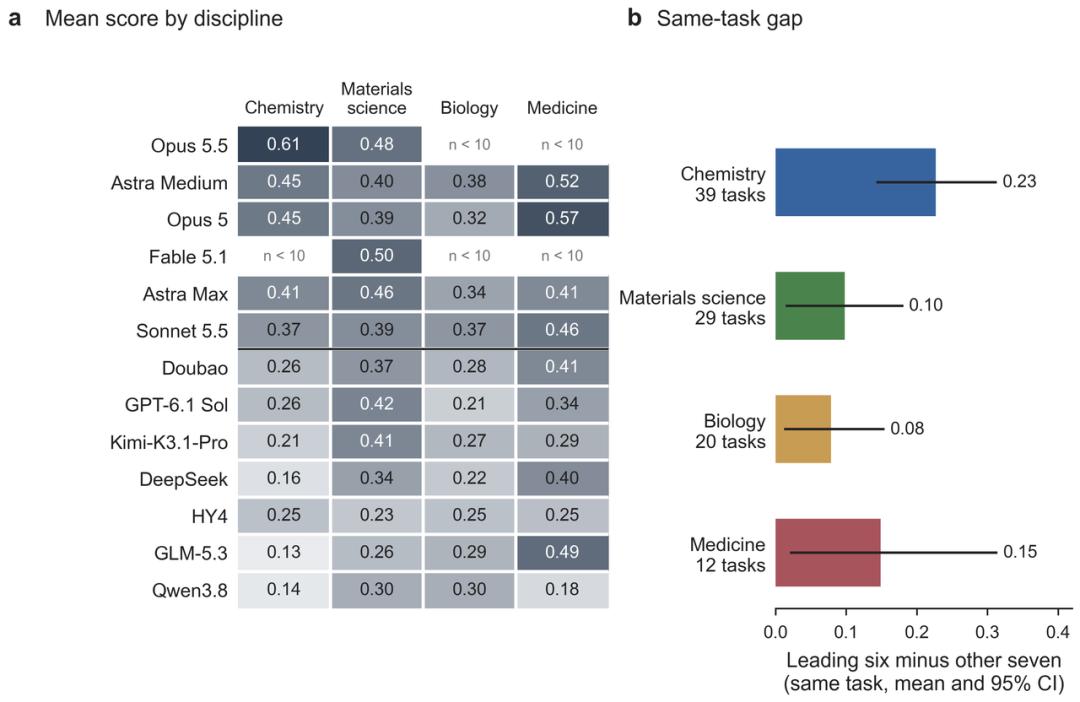
△Comparative analysis of behaviors between the leading group and the lagging group
However, there are gaps between different models, and the average performance can be divided into two tiers: the leading group (6 models) and the lagging group (7 models).
In the same question comparison, the leading group is on average about 0.15 points higher than the other seven models.
There is another detail worth noting: about 9% of the tasks in the leading group have scores lower than 0, while this proportion can be as high as 22% in the other seven configurations.
Here 0 refers to the average score of random effective ranking, and a negative score means that the prediction is negatively correlated with the actual ranking.
Where exactly does the gap come from? The research team dug deeper.
They first synthesized the predictions of other models in the same question into a reference ranking, then paired the experiments two by two, compared with the actual measured results, and checked whether each model got the pair right independently.
For the experiment pairs where the reference ranking is correct, the leading group can get 86% of the pairs right, while the other seven configurations get 78% right; for the experiment pairs where the reference ranking is wrong, the proportion of independent correct ranking in both groups is around 30%.
So part of the advantage of the leading group is precisely reflected in the places where the joint prediction is correct, and the leading group is always more stable in these parts.

As for why the model deviates from the correct judgment, there are more specific clues in the operation records.
Take the solution task as an example: for the same polymerization reaction, 12 solvents are replaced in turn, and the task requires ranking according to the mass of the polymer finally separated.
Opus 5.5 scores 0.874, Qwen3.8 scores -0.126. There are 66 pairs in total for 12 candidate solvent conditions, the former gets 56 pairs right, while the latter gets 30 pairs right.
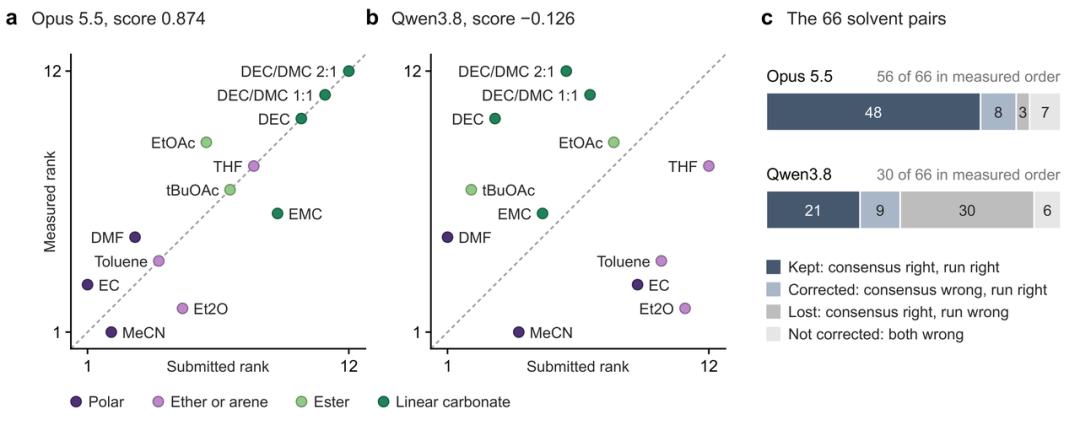
△Two executions of Opus and Qwen on the same task
Analysis shows that this is because the two models pay attention to different factors from the very beginning:
Qwen3.8 mainly sorts according to how much ethylene the solvent can dissolve, while Opus 5.5 pays more attention to the miscibility of raw materials and the compatibility of the catalyst in the solvent.
Although Qwen3.8 also discovered this problem during the calculation process, it ultimately failed to directly change the final ranking basis adopted by the model.
Therefore, the most likely stage where prediction errors occur is the step of selecting the judgment basis. The model also needs to learn to adjust the sorting method in time according to clues, so that these discoveries can truly affect the final answer.
Looking at it separately, these differences will also change with specific disciplines and tasks.
Among the scored results of various disciplines in public tasks, the model with the highest average score in chemistry is Opus 5.5, in materials science is Fable 5.1, in biology is GPT-6 Astra Medium, and in medicine is Opus 5.
P.S. Fable 5.1 and Opus 5.5 have rejection to answer phenomenon.