2026 Q3 China Mobile Internet Traffic Quarterly Report
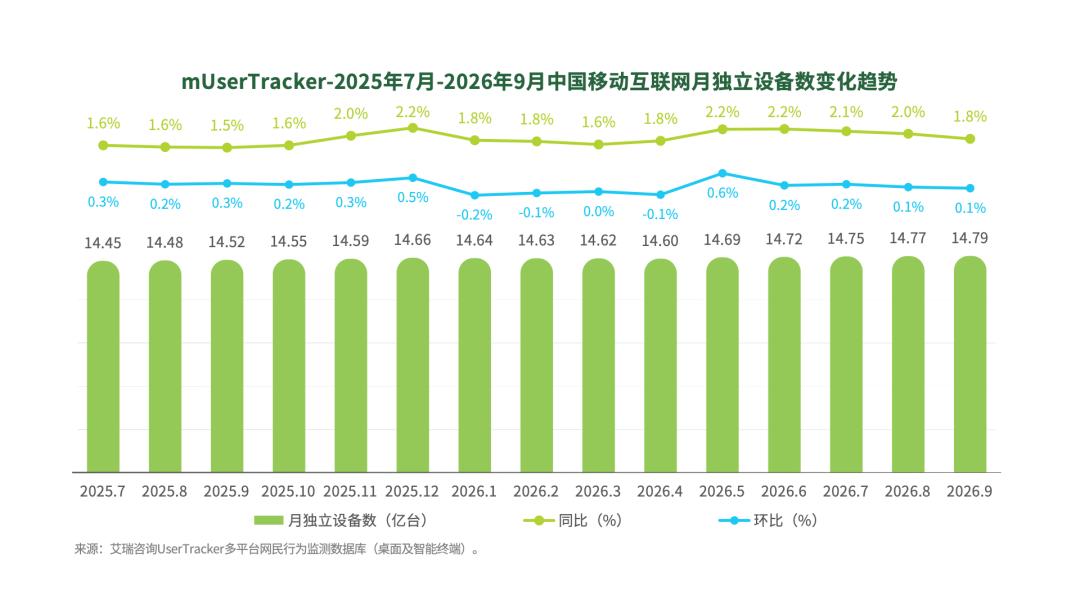
In September 2026, the number of monthly unique devices of China's mobile internet reached 1.479 billion, with a year-on-year increase of only 1.8% and a month-on-month growth of 0.1%; the average daily usage times per device rose to 65.09, and the effective usage duration dropped to 274.72 minutes. The overall user scale is basically stable, but user attention is further fragmented.
The artificial intelligence industry has become a prominent growth track in this quarter, with the number of unique devices hitting 835 million, representing a 54% year-on-year increase. However, users are still dominated by shallow trial usage and have not formed stable usage habits. The travel and tourism industry shifted from the summer peak to purpose-driven queries, with family tours driving obvious growth. The e-commerce user scale returned to the highest point of the year: the frequency of APP openings decreased, but the single-session user stay duration extended, and shopping behaviors became more focused. The video entertainment industry presents a differentiated pattern: "The scale of short-video users is approaching a phased upper limit, online video users switch across multiple platforms, and micro-dramas are becoming more high-quality."
The Q3 growth rate list also confirms this structure: the top 3 growing apps with over 400 million users are Doubao, Baidu Maps, and Tencent Video; the top 3 in the 100 million to 400 million tier are Trip.com, Xianyu, and China Railway 12306; among mid-tier applications, Feishu, China Auto Rental, Ant Afu, and NetEase Mail lead in growth rate.
Overview of China's Mobile Internet Development
China Mobile Internet - Overall User Traffic Trend
Q3 overall mobile internet users remain stable above the 1.47 billion mark, entering a steady growth period
The total number of monthly unique devices across the network maintains moderate growth, rising to 1.479 billion in September, but the year-on-year growth has dropped to 1.8%, and the month-on-month growth is only 0.1%, with growth momentum continuing to weaken. The device market is approaching the penetration upper limit, and the stage of driving growth solely by new users has basically ended. Subsequent competition across tracks will focus on competing for the attention allocation and usage depth of existing users.
China Mobile Internet - User Profile
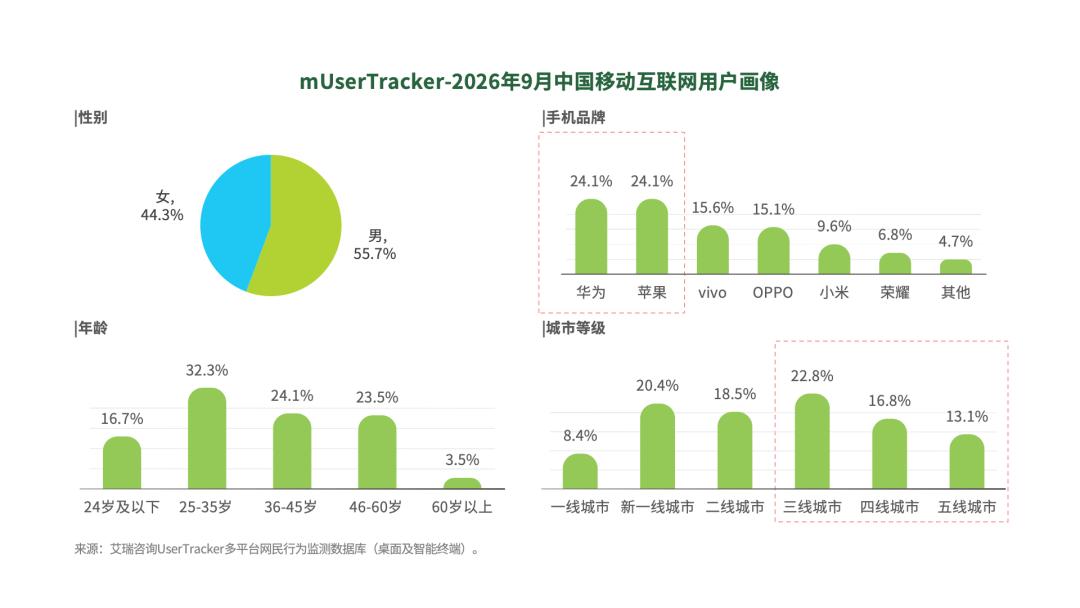
The structure of mobile internet users continues to sink, with users from tier-3 and lower-tier cities accounting for over 50%
In September, the gender structure of mobile internet users remained stable; users aged 25-45 accounted for 56.4% in total, forming the main force of internet consumption. Huawei and Apple are in the first echelon among mobile phone terminals. The city distribution is characterized by the dominance of middle-tier cities: tier-3 city users (22.8%) account for the highest proportion, followed by new first-tier (20.4%) and second-tier (18.5%) cities. The sinking market provides a stable user base and is also a key area for subsequent traffic mining.
China Mobile Internet - User Behavior Trend
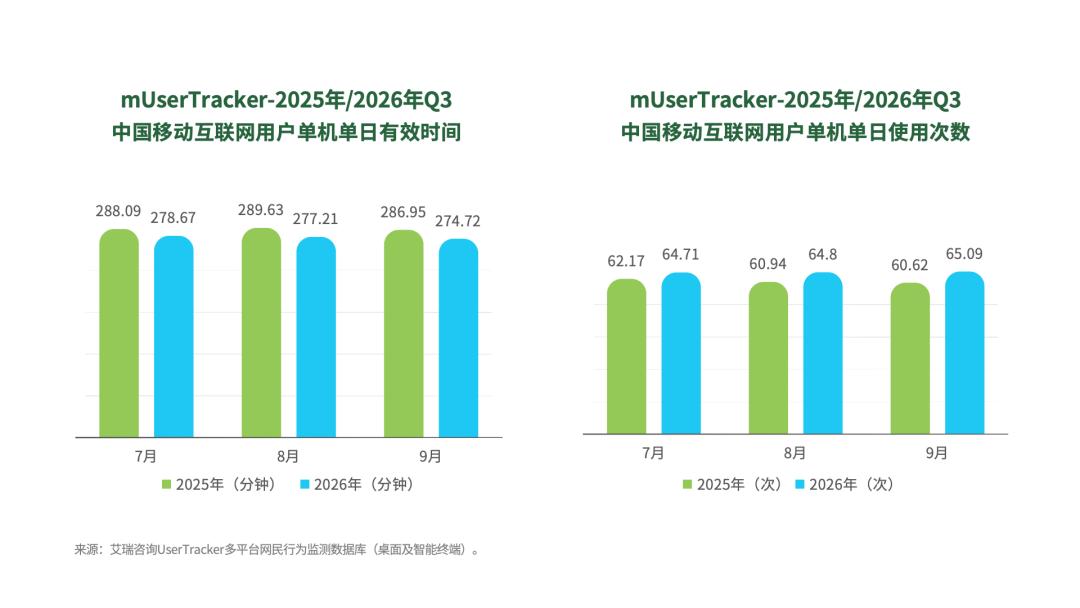
User attention is highly fragmented, with usage frequency reaching 65.09 times in September, but the stay duration is declining
Compared with the same period in 2025, the average daily effective usage duration per device for users in Q3 2026 decreased overall, while the number of daily usage times continued to rise, reaching 65.09 times in September. This contrast of one decrease and one increase indicates that users' behavior of long, uninterrupted immersive internet access has decreased, and they are more likely to use multiple apps in an interleaved, short-term way. Traffic is further scattered, and the user stay depth of single-point applications is diluted.
China Mobile Internet - Industry-specific User Traffic Pattern
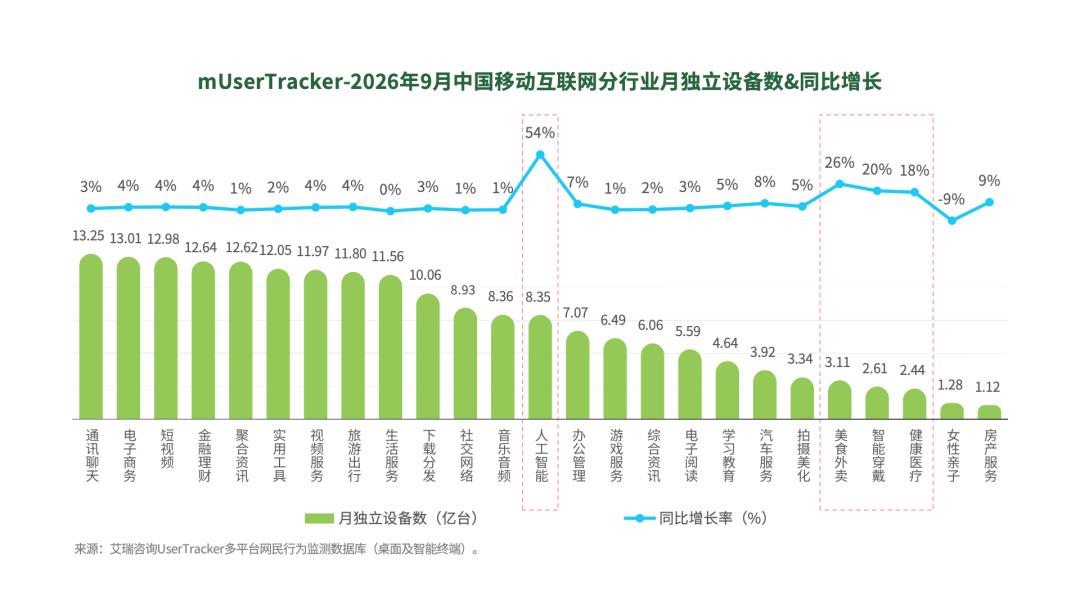
Artificial intelligence, with 54% year-on-year growth, becomes the only explosive growth track, while the growth of social, e-commerce and short-video sectors slows down
The user base of the three major tracks of communication and chat, e-commerce, and short videos is already at a high level, with a gentle growth pace. In September, the number of unique devices in the artificial intelligence track reached 835 million, with a year-on-year growth rate as high as 54%, significantly leading all industries. The incremental space of traditional mature tracks is limited, and emerging tracks represented by AI are rapidly seizing users and reshaping the traffic distribution pattern of the mobile internet.
China Mobile Internet - Industry-specific User Usage Duration
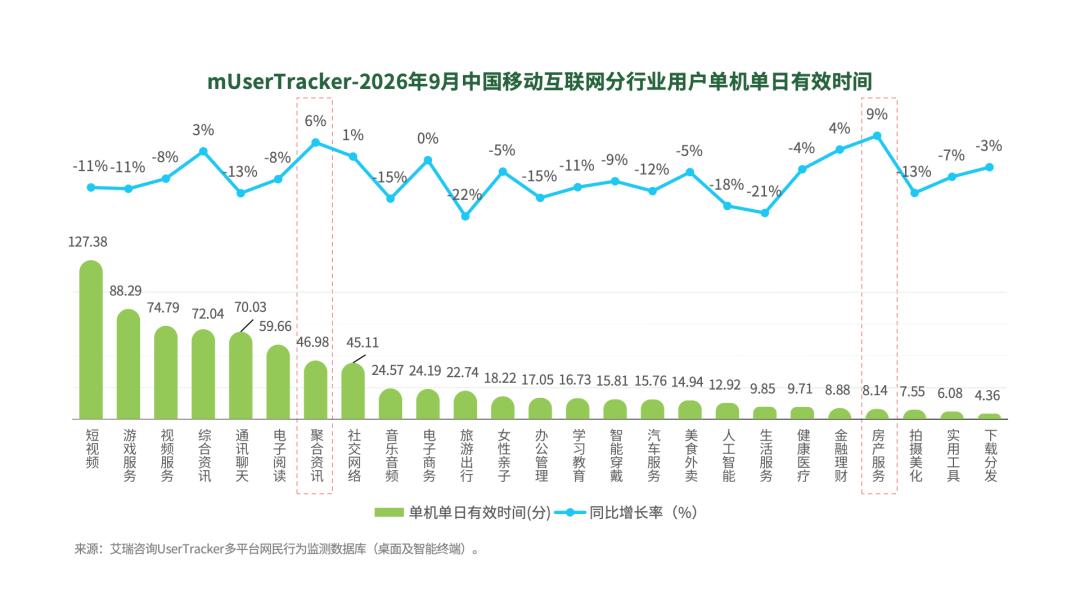
Short videos record 127.38 minutes of average daily usage duration per device, and the overall stay duration of pan-entertainment applications declines comprehensively
Short videos occupy an absolute advantage with 127.38 minutes of average daily effective usage duration per device. Game services (88.29 minutes), video services (74.79 minutes), and communication and chat (70.03 minutes) form the second echelon, and content entertainment applications are still the deep usage scenarios for users. From a year-on-year perspective, the usage duration of most tracks has declined, with travel and tourism (-22%), life services (-21%), and artificial intelligence (-18%) leading the contraction. Users are generally more prudent in time investment, and the differentiation between long-time entertainment consumption and short-time practical usage is intensifying.
China Mobile Internet - Industry-specific User Usage Frequency
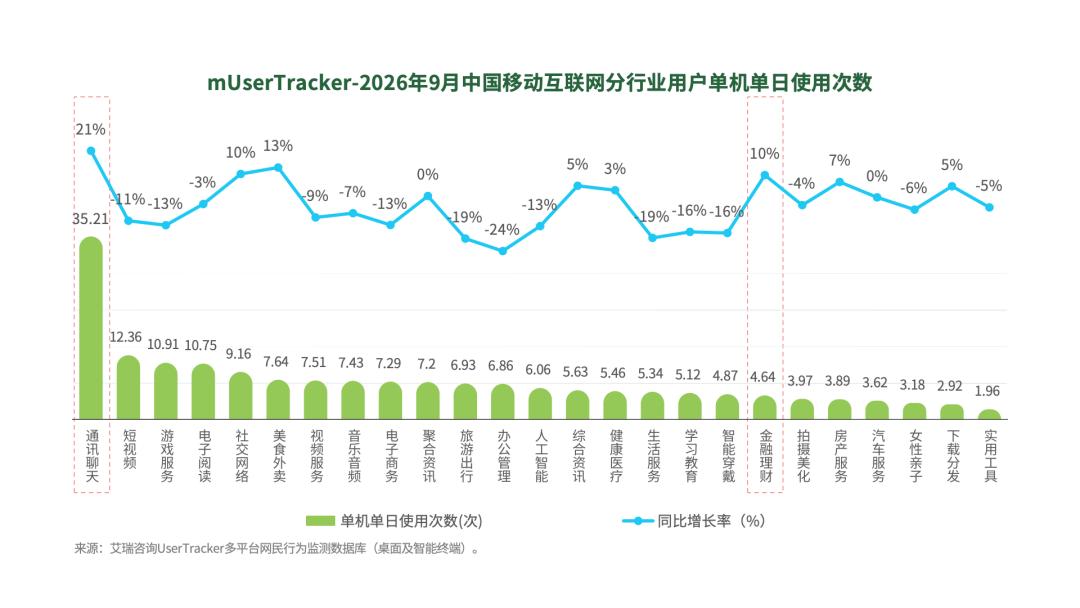
The average daily usage times per device for communication and chat reaches 35.21, while the opening frequency of short videos and games drops significantly
The average daily usage times per device for communication and chat reaches 35.21, leading by a large margin with a year-on-year growth rate as high as 21%, and its position as a high-frequency entry is being consolidated and strengthened. Short videos, game services, and e-reading follow. Food delivery (+13%), social networks (+10%), and financial management (+10%) rank top in year-on-year growth, with rising calling frequency. The frequency of office management (-24%), travel and tourism (-19%), life services (-19%), and artificial intelligence (-13%) shrinks significantly. The more tool-oriented the scenario is, the more users tend to open it on demand and leave immediately after use, and the stickiness of daily social and local service applications is increasing.
Key Segmented Industry Details
Travel and Tourism
Travel and Tourism — Hotspot Tracking
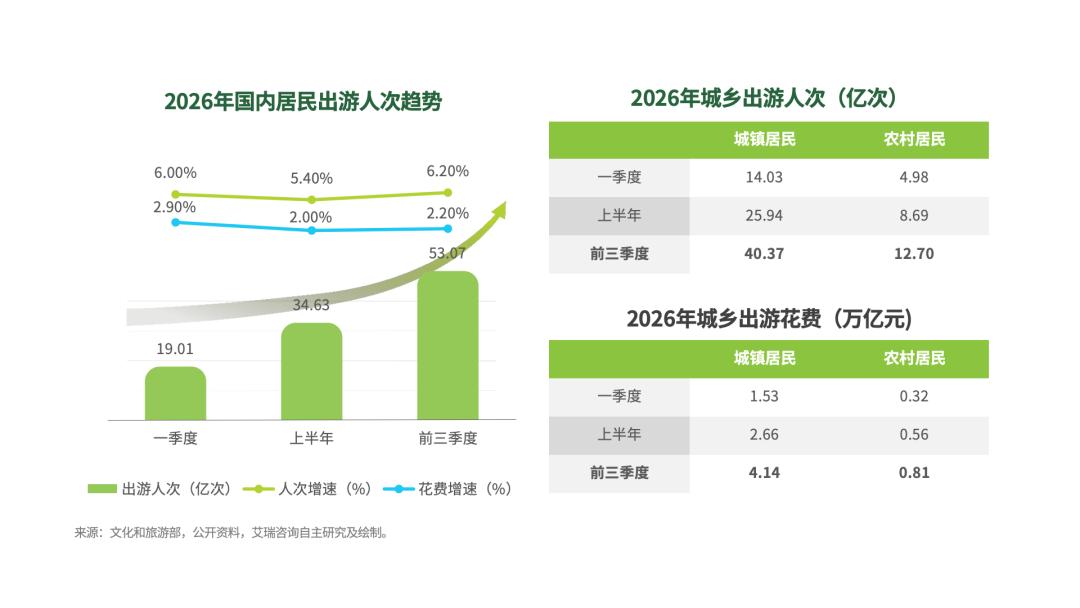
Domestic residents show strong travel willingness but tend to be prudent in consumption
In the first three quarters of 2026, the number of domestic resident trips reached 5.307 billion, with the trip growth rate rebounding to 6.20% and the travel expenditure growth rate at 2.20%. By urban-rural structure, urban residents made 4.037 billion trips with a travel expenditure of 4.14 trillion yuan, still forming the base of tourism consumption. Rural residents made 1.27 billion trips with a travel expenditure of 0.81 trillion yuan, showing considerable market incremental space. Overall, the recovery pace of trip numbers is better than that of consumption amount, and there is obvious differentiation in both trip number and customer unit price between urban and rural markets.
Travel and Tourism - Overall User Scale Trend
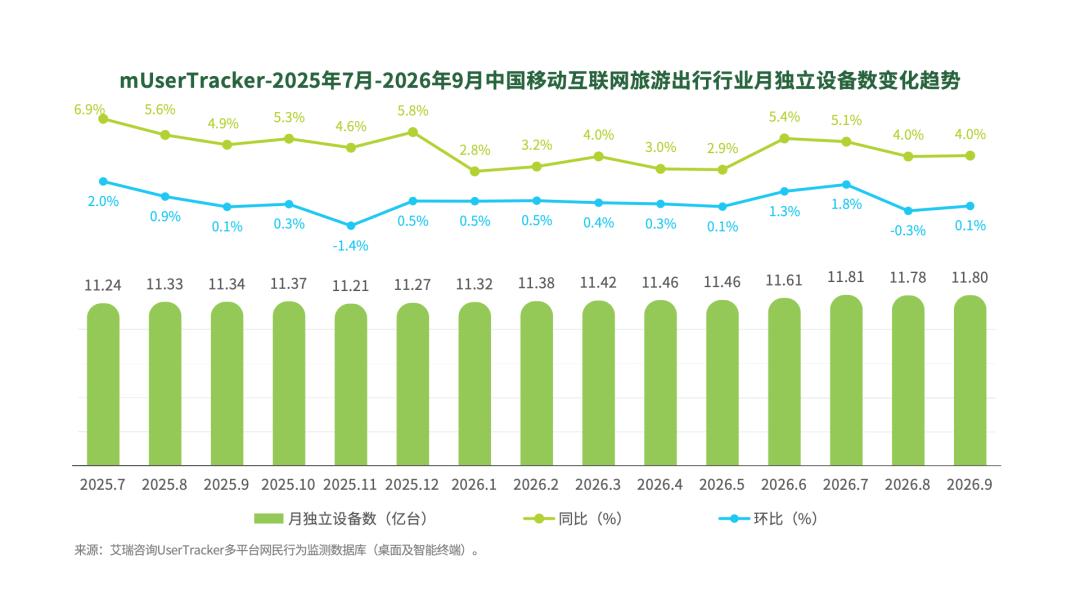
The user scale exceeded 1.18 billion in September, with obvious driving effect from the July summer peak, and the overall scale remained at a high level
In the third quarter of 2026, the monthly number of unique devices in the travel and tourism industry remained between 1.178 billion and 1.181 billion, reaching the quarterly peak of 1.181 billion in July, and dropping slightly in August and September, without obvious trend-like shrinkage. In terms of growth performance, the year-on-year growth rate in each month of Q3 maintained positive growth, and the month-on-month fluctuated naturally with the peak and off-peak travel seasons: the month-on-month growth rose to 1.8% in July, turned to -0.3% in August, and rebounded to 0.1% in September. Under the stock market, the monthly incremental space is limited, and the growth pace changes with the rhythm of travel demand.
Travel and Tourism - User Stickiness
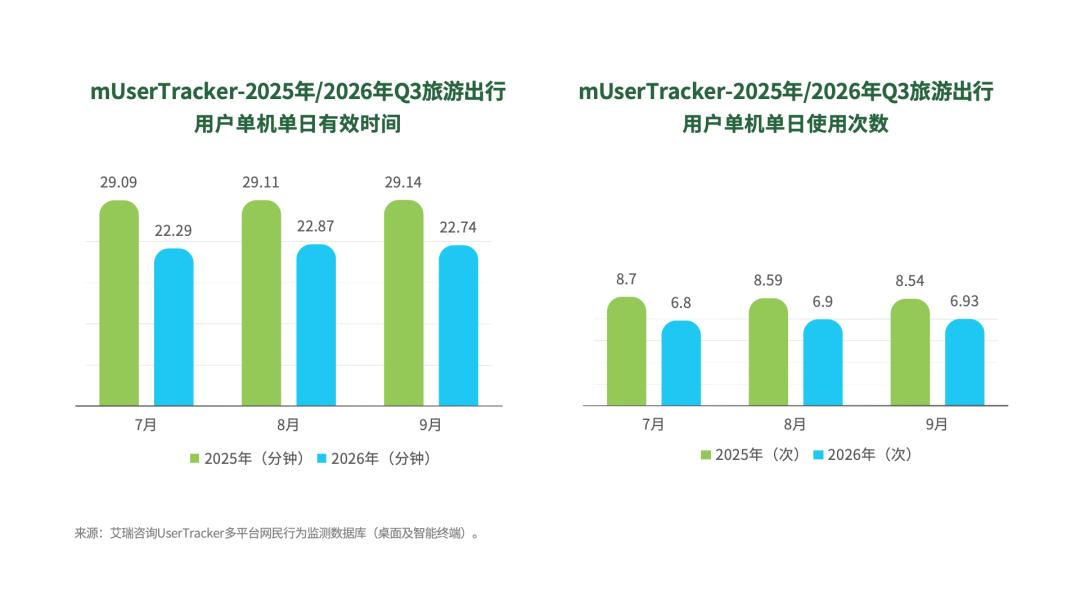
User stickiness of the travel and tourism industry decreased in Q3, with both duration and frequency weakening simultaneously
From July to September 2026, the average daily effective time and usage frequency per device for travel and tourism users fluctuated very slightly. User usage habits remained stable during the Q3 period, with no trend of rising stickiness driven by the peak season. Compared with the same period last year, the two stickiness indicators of duration and frequency declined simultaneously. It is inferred that most users make purpose-driven queries and place orders, with fewer behaviors of browsing for a long time and opening the app repeatedly, shifting from high-frequency in-depth browsing to short-term rigid demand usage.
Travel and Tourism - User Profile
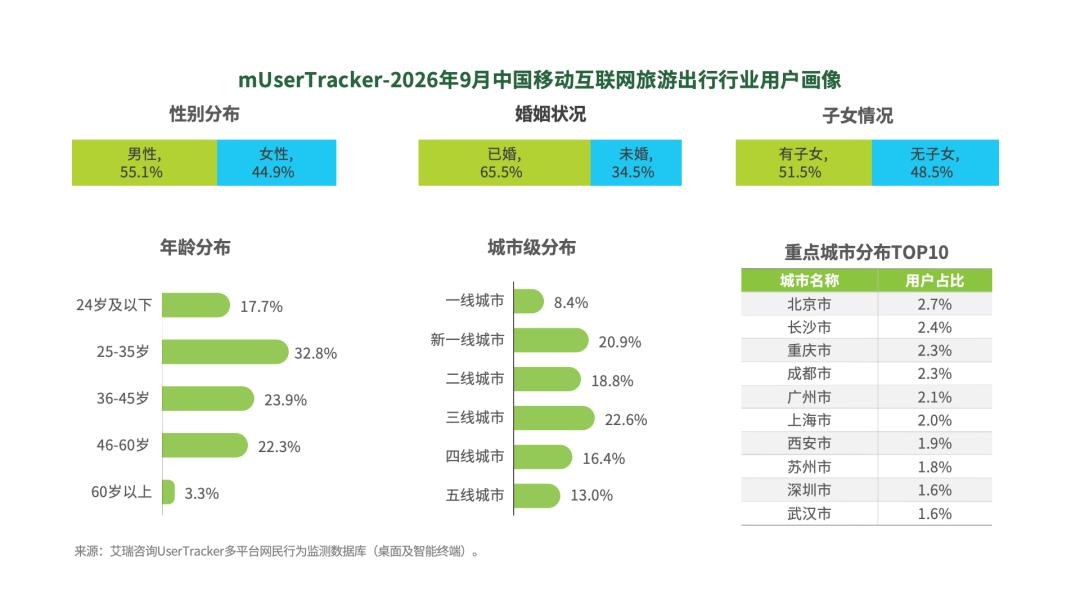
Family tours become the absolute main force, and tier-3 city users account for 22.6%
The gender structure of users slightly tilts towards males; the age focus falls on 25-35 years old (32.8%), and together with the mature group aged 36-60, they form the main user group. Married users with children account for more than half, and family travel demand forms the base. Users from tier-3 cities (22.6%) and new first-tier cities (20.9%) contribute a lot, while the contribution from first-tier cities (8.4%) is relatively limited. The top 10 tourist source cities are scattered, and cities with strong leisure cultural tourism attributes such as Changsha, Chongqing, and Chengdu show high attractiveness to platform users.
Travel and Tourism - Segmented Industry Traffic Trend
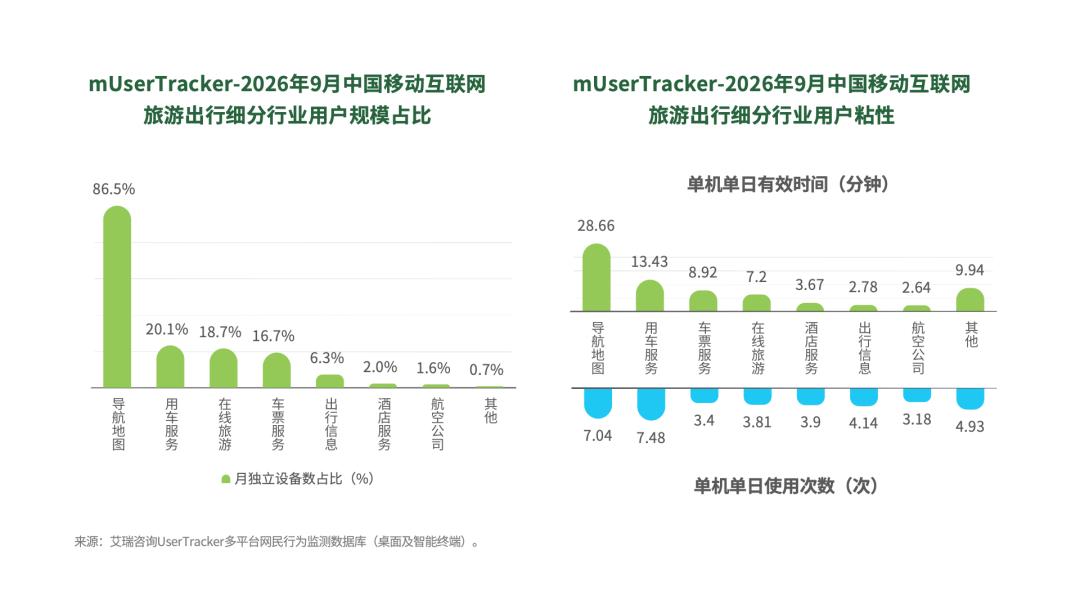
Navigation maps become the "super entry" for travel and tourism, and the frequency of car usage services surpasses that of navigation maps
Users in the navigation map track account for 86.5%, which has the attribute of a basic entry in the travel and tourism ecosystem. Car usage services, online travel, and ticket services are the secondary traffic sectors in turn, while vertical service tracks such as hotels and airlines have low user coverage. Ticket services (8.92 minutes) and online travel (7.2 minutes) show strong content retention capability, while pure tool categories (hotel services / airlines / travel information) have low stickiness.
Travel and Tourism - Overview of Popular Apps
Leading navigation and ride-hailing apps enter low-growth stock game, and China Auto Rental leads the growth list with 10.7%
Amap and Baidu Maps form a traffic base relying on their navigation tool attributes, with user volume significantly higher than that of railway, ride-hailing and OTA platforms, and industry traffic is highly concentrated in basic travel entries. However, mainstream leading platforms have entered the stock competition range, with generally slow growth rates. China Auto Rental (10.7%) achieved high compound growth against the trend in the third quarter. User activity varies across platforms: Hello and Amap have prominent high-frequency access features, while vertical applications for airlines and ticketing belong to scenario-triggered usage.