Increase positions, buy the dip, there is another 17.3 billion yuan of net inflow.
On October 29, the A-share market opened lower and moved lower throughout the day, with both the Sci-Tech Innovation Board and ChiNext indices falling by more than 4%. By market close, the Shanghai Composite Index fell 0.82% to close at 3651.43 points, the Shenzhen Component Index dropped 2.92%, and the ChiNext Index slid 4.45%. On that day, computing power hardware stocks saw a sharp correction, the banking sector bucked the trend to strengthen, commercial aerospace stocks rallied, and multiple ETFs tracking the CSI 300 index saw concentrated volume surge in late trading.
The overall capital flow of stock ETFs showed a net inflow trend. On October 29, the total net inflow of stock ETFs across the whole market reached 173.95 billion yuan, among which the net inflow of broad-based ETFs was prominent, hitting 171.46 billion yuan in the previous trading day, and the CSI 300 index recorded the top single-day net inflow amount.
Broad-based ETFs recorded a net inflow of 171.46 billion yuan on October 29
Wind data shows that as of October 29, the total size of 1618 stock ETFs (including cross-border ETFs) in the whole market reached 3.37 trillion yuan.
From the perspective of major categories, broad-based ETFs and industry-themed ETFs took the lead in net inflow in the previous trading day, reaching 171.46 billion yuan and 16.01 billion yuan respectively.
The CSI 300 index saw the most obvious single-day net capital inflow, with a net inflow of 88.85 billion yuan in the previous trading day. Followed by the ChiNext, which recorded a single-day net inflow of 59.7 billion yuan. The STAR 50 Index and CSI A500 Index also ranked top in single-day net capital inflow, reaching 45.1 billion yuan and 20.2 billion yuan respectively.
From a longer time dimension, observed from the perspective of the past 5 days, the cumulative capital inflow into the CSI 300 index has reached 661 billion yuan recently, and the cumulative inflow into the CSI A500 has exceeded 215 billion yuan.
In terms of industry themes, the communication ETF ranked top in single-day net capital inflow, reaching 13.6 billion yuan.
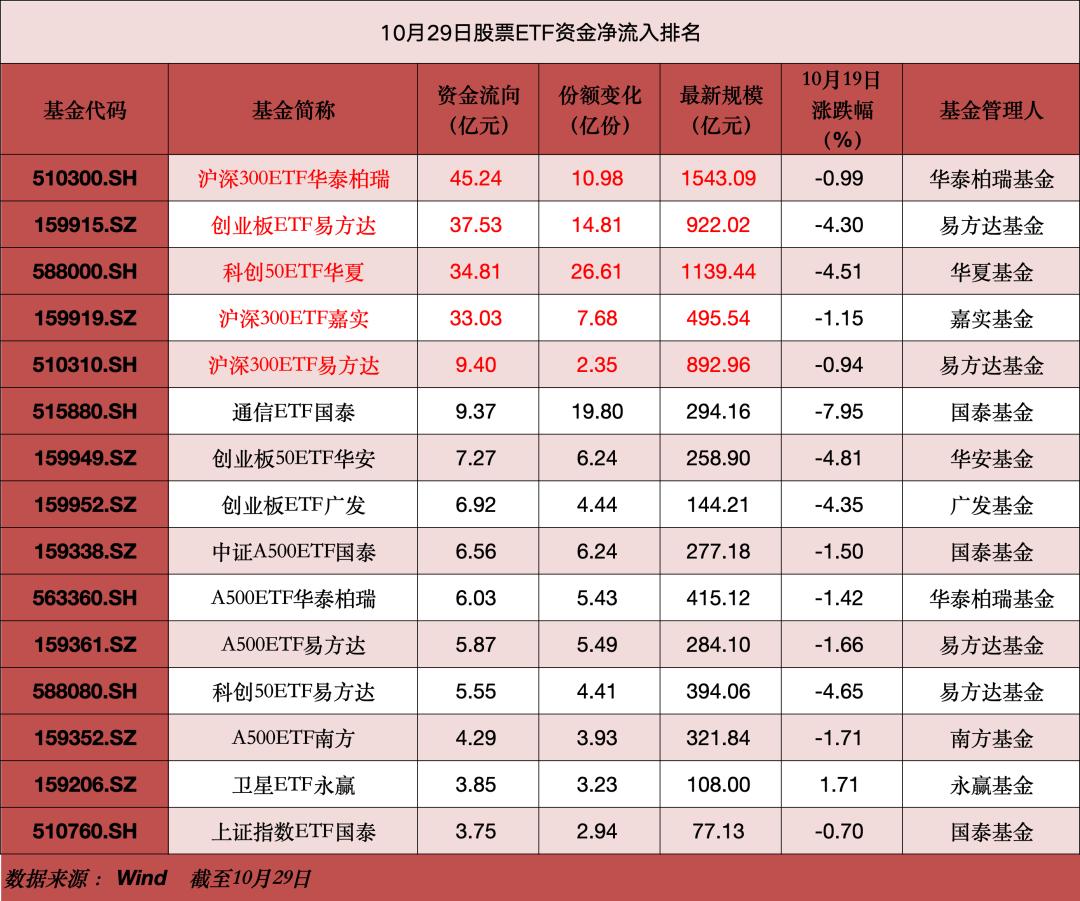
In terms of leading public offering funds, multiple broad-based ETF products under their management have seen obvious capital anomalies. The latest size of E Fund's ETF business is 6848.5 billion yuan. The size of E Fund ChiNext ETF is 922.02 billion yuan, with a net inflow of 37.53 billion yuan; the size of E Fund CSI 300 ETF is 892.96 billion yuan, with a net inflow of 9.4 billion yuan; the size of E Fund A500 ETF is 284.1 billion yuan, with a net inflow of 5.87 billion yuan; the size of E Fund STAR 50 ETF is 394.06 billion yuan, with a net inflow of 5.55 billion yuan; the size of E Fund Robot ETF is 183.7 billion yuan, with a net inflow of 3.4 billion yuan.
As for China Asset Management's ETF business, in the previous trading day, ChinaAMC STAR 50 ETF and ChinaAMC Communication ETF ranked top in single-day net inflow, recording 34.81 billion yuan and 1.56 billion yuan of net inflow respectively, with the latest size reaching 1139.44 billion yuan and 130.67 billion yuan respectively, and the average daily turnover of their corresponding tracking indices in the past month is 95.2 billion yuan and 7.5 billion yuan respectively. The net inflow of ChinaAMC ChiNext Growth ETF also exceeded 100 million yuan.
As for Southern Asset Management's ETF business, Southern CSI A500 ETF recorded a single-day net inflow of 429 million yuan, with a current size of 321.84 billion yuan; Southern ChiNext ETF recorded a single-day net inflow of 900 million yuan, with a current size of 38.57 billion yuan; Southern ChiNext AI ETF recorded a single-day net inflow of 810 million yuan, with a current size of 16.02 billion yuan; Southern Semiconductor ETF recorded a single-day net inflow of 160 million yuan; Southern ChiNext Computing Power ETF recorded a single-day net inflow of 140 million yuan; Southern STAR Market Growth ETF recorded a single-day net inflow of 180 million yuan.
As for Fullgoal Fund's ETF business, Fullgoal SSE Composite Index ETF bucked the trend to attract capital. Wind data shows that from the beginning of 2026 to October 29, its interval net inflow reached 137 billion yuan. In the past 20 trading days, this ETF has obtained a net capital inflow of nearly 74 billion yuan, showing a prominent trend of capital "accumulation". At present, the size and share of Fullgoal SSE Composite Index ETF are 193.63 billion yuan and 204.38 billion shares respectively. In 2026, its share and size increased by 145.14 billion shares and 134.86 billion yuan respectively, making it the SSE Composite Index ETF with the largest share growth and the largest size in the current market.
The net outflow of Hong Kong stock market ETFs is prominent
In terms of net capital outflow, the net outflow of Hong Kong stock market ETFs is prominent, reaching 13.62 billion yuan; in terms of size change, the size of industry-themed ETFs decreased by 283.15 billion yuan.
Some broad-based ETFs saw net outflow. The single-day net outflow of CSI 1000 ETF and CSI 500 ETF also ranked top, reaching 27.7 billion yuan and 24.9 billion yuan respectively.
In addition, the semiconductor-themed ETF recorded a single-day net outflow of 10.5 billion yuan.
Looking forward to the market outlook, Wang Baohe, fund manager of Fullgoal SSE Composite Index ETF, said that recent market fluctuations are mainly affected by combined factors including the geopolitical situation in the Middle East, tightening overseas liquidity and narrative changes on the AI industry end, but relevant disturbances have seen marginal easing. From the perspective of the domestic market, multiple trading and liquidity indicators of the A-share market are close to the historical bottom range. At the same time, broad-based ETFs continue to see massive net inflows, and broad-based ETFs represented by the CSI 300 have seen intraday pulse-style net purchases for many times. On the whole, with the marginal easing of external disturbances, the continuous implementation of internal market stabilization mechanisms, the natural clearing of market capital, and the gradual repair of corporate earnings, the SSE Composite Index has shown relatively obvious bottom allocation value, and it is expected that the short-term market will mainly see shock bottoming and moderate rebound.
Specifically for sectors, Southern Asset Management believes that China's pharmaceutical industry is one of the few industries where demand can still undergo major changes at present, and it is in a major upward cycle. The resonance formed by the cash flow realization brought by the overseas expansion of innovative drugs and the two-way verification of CXO order performance means that the recent pullback of Hong Kong-listed pharmaceutical stocks last week may provide a better risk-return ratio for medium and long-term allocation. For gold stocks, looking ahead, the continuous gold purchase by global central banks, US fiscal deficit constraints and the trend of diversified dollar credit will still provide medium and long-term support for gold assets, but short-term gold prices are still affected by the interest rate path, dollar trend and capital side fluctuations. If deleveraging pressure recurs, sector fluctuations may intensify. Follow-up focus can be placed on whether gold prices can continue to stabilize, central bank gold purchase data and changes in the global liquidity environment. For the non-ferrous metal sector, if the pressure from the dollar and interest rates eases, Sino-US trade frictions see marginal improvement, and downstream demand gradually recovers, there may be valuation repair space for the non-ferrous metal sector.
This article is from the WeChat Official Account "China Fund News" (ID: chinafundnews), written by Wang Siwen, published with authorization from 36Kr.