The most reliable warning indicator for the US stock market has lit up, and on both of the two occasions it flashed in history, a major bear market followed.
A key indicator that has tracked the US stock market for nearly 70 years is issuing a rare alert.
The "Quality Minus Junk Factor" (QMJ), which measures the relative performance of high-quality stocks and junk stocks, reversed abruptly in July this year after the longest and deepest junk stock outperformance cycle in history — and every similar reversal in history has heralded the arrival of a major bear market.
In July this year, QMJ recorded its largest single-month gain of 14.3% since records began in 1957. Meanwhile, the basket of unprofitable tech stocks tracked by Goldman Sachs fell by 11% in the third quarter, while high-quality consumer stocks such as Procter & Gamble and Coca-Cola staged a strong rebound. F. Porter Stansberry, founder of investment research firm Porter and Company, warned that this signal means "it is time to be cautious".
Historical data shows that the second and third largest single-month gains of QMJ occurred in November 2000 and October 2008 respectively — right on the eve of two major bear markets. The current junk stock bubble driven by the artificial intelligence boom is already the largest on record in AQR's nearly 70 years of data, and the market impact brought by its burst cannot be underestimated.
The Largest Junk Stock Bubble in History: Three-Year Outperformance Driven by AI Frenzy
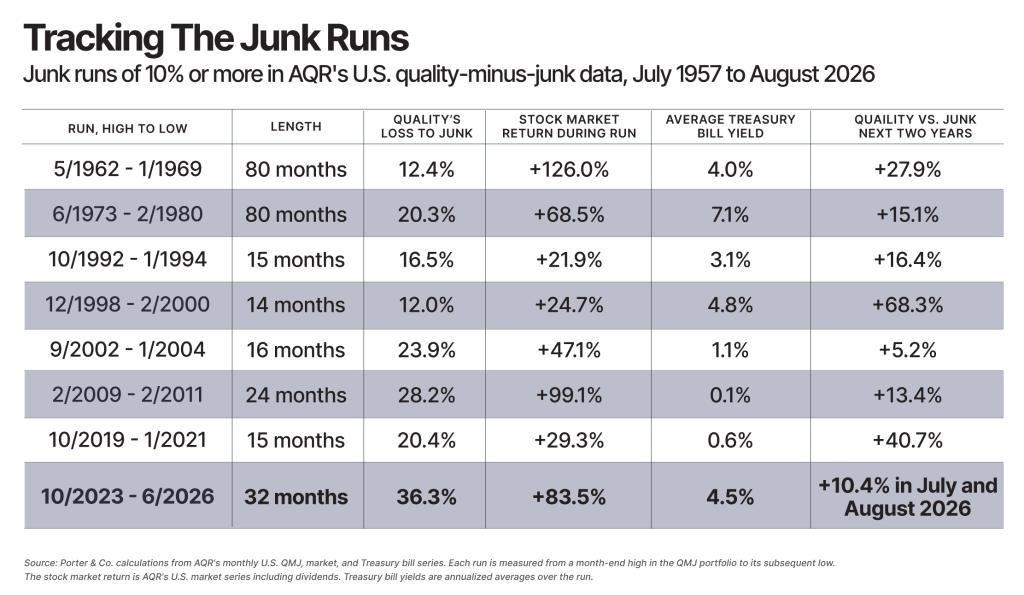
This cycle of junk stocks outperforming high-quality stocks began in November 2023 and continued until June 2026, with both duration and magnitude hitting historical records.
During this period, an investment portfolio that goes long on the highest-quality U.S. enterprises and shorts the lowest-quality enterprises recorded a cumulative loss of 36% — the worst performance period for the QMJ factor since records began in 1957. The 12 months ending in May 2026 was even the 12-month period with the worst performance of quality stocks in the entire 69-year record. Quality stocks recorded losses for three consecutive years in 2023, 2024 and 2025, and fell another 3.8% in the first 8 months of 2026.
The core logic driving this phenomenon is investors' fanatical pursuit of artificial intelligence technology. According to Bloomberg data, the basket of unprofitable tech stocks tracked by Goldman Sachs rose by 57% in the first five months of 2026, while the S&P 500 index only rose by 11% in the same period. Taking the Russell 2000, a small-cap index where unprofitable enterprises account for more than a quarter, as an example, its increase in the first half of this year reached 22.7%, more than twice the increase of the broader market.
Stansberry defined this phenomenon as a "tech-driven junk stock bubble" and pointed out that it is the largest one on record.
The QMJ Factor: A 69-Year Ruler Tracking Market Rationality
To understand this alert signal, we first need to understand the construction logic and historical background of the QMJ factor.
The QMJ factor was proposed by Cliff Asness, founder of AQR Capital Management, and his colleagues Andrea Frazzini and Lasse Heje Pedersen in 2013, and the relevant paper was published in *Review of Accounting Studies* in 2019. Asness studied under Eugene Fama, the Nobel laureate in Economics, whose research proved that the market can price effectively most of the time.
The QMJ factor defines "quality" as three types of characteristics for which investors should pay a premium: profitability, growth and safety. Profitability is measured by six different indicators; growth tracks changes in earnings per share over the past five years; safety integrates the volatility of stocks relative to the S&P 500 (beta value), two balance sheet robustness models, Ohlson O-Score and Altman Z-Score, as well as the fluctuation degree of return on equity over the past five years.
This factor scores and ranks all listed stocks in the United States every month, goes long on the top 30% of the highest-scoring stocks (high-quality stocks), shorts the bottom 30% of the lowest-scoring stocks (junk stocks), weights by market capitalization and rebalances monthly. The U.S. data published by AQR dates back to July 1957. It is worth noting that the QMJ factor does not consider valuation at all, and only measures quality itself.
In the long run, from July 1957 to August 2026, high-quality stocks outperformed junk stocks by 3.6% per year, which proves that there is a systematic underestimation of quality in the market.
Historical Pattern: Bear Markets Often Follow the Burst of Junk Stock Bubbles
AQR's historical data reveals a clear pattern: cycles in which junk stocks significantly outperform high-quality stocks often end with a sharp market correction — but only if this phenomenon is driven by investor frenzy rather than a bear market rebound.
Since 1957, the QMJ factor has experienced a total of 8 downward cycles with a decline of more than 10%. Among them, there are three typical cases driven by technological innovation frenzy: the electronics and computer boom in the 1960s, the dot-com bubble in 1999, and the electric vehicle, cryptocurrency and remote work boom in 2020.
In the two years after the burst of these three bubbles, high-quality stocks outperformed junk stocks by 28%, 68% and 41% respectively; the overall performance of the stock market in the same period was -4.5%, -23.5% and +6.4% respectively (the last one still recorded positive returns because the base was the low point after the COVID-19 crash).
In contrast, there is also a "benign" scenario where junk stocks outperform high-quality stocks — that is, after a major bear market, central banks inject massive liquidity, and weak enterprises on the verge of bankruptcy can survive, with their share prices rebounding sharply from the bottom. The data in the 1970s, 1992, 2002 and 2009 all conform to this pattern.
The current cycle obviously does not belong to the latter. The S&P 500 has continued to hit new all-time highs during this period, and the outperformance of junk stocks is completely driven by the AI boom, not supported by cheap valuation or the logic of bear market rebound.
Style Switch Has Begun: High-Quality Stocks Are Making a Strong Comeback
The signal of market style switch has emerged, and it is coming fiercely.
In July this year, the QMJ factor rose by 14.3% in a single month, setting the largest single-month gain since 1957. The basket of unprofitable tech stocks tracked by Goldman Sachs fell by 11% in the third quarter, while highly speculative stocks that had previously significantly outperformed the broader market were hit hard: AST SpaceMobile (ASTS) fell by 56%, and D-Wave Quantum (QBTS) fell by 52%.
At the same time, high-quality consumer goods stocks staged a strong rebound. Since June 30, Procter & Gamble (PG) has risen by 12.9% and is expected to post its best monthly performance since October 1998; Coca-Cola (KO) rose by 17.3%; Church & Dwight (CHD) rose by 12.4%; Colgate-Palmolive (CL) rose by 6.2%. The S&P 500 index only rose by 2.3% in the same period.
Stansberry pointed out that the second and third largest single-month gains of QMJ in history occurred in November 2000 and October 2008 respectively, both on the eve of major bear markets. This historical comparison makes the current market signal even more worthy of vigilance. For investors, tilting towards high-quality, high-profitability enterprises may be a more robust choice in the current environment.
This article does not constitute personal investment advice and does not represent the views of the platform. The market is risky, investment needs to be cautious, please make independent judgments and decisions.
This article is from the WeChat official account "Wall Street CN", Author: Bu Shuqing, published with authorization from 36Kr.