The Q3 fund size rankings are officially announced: the pattern of offense and defense reverses in the "adjustment quarter" (complete rankings attached)
For the entire public offering fund industry, the third quarter has become this year's "decisive quarter".
In the resurgence of tech stocks, the perceptions and responses of various products, business lines, and customer groups will largely determine the full-year rankings.
Signs of shifts have already emerged.
According to statistics from Wind, by the end of the third quarter, the total non-monetary fund size of fund companies (excluding feeder funds) fell by about 2% month-on-month compared with the mid-year figure, which stands in sharp contrast to the general size growth of industry companies in the first two quarters of this year.
However, some companies are bucking the trend to record growth. Southern Asset Management, Haifutong, BlackRock Fund, Penghang Fund, CITIC-Prudential, Oriental Fund, Changsheng Fund and others have seen their scale increase by 10 billion to 62 billion yuan against the trend, with their industry rankings rising significantly.
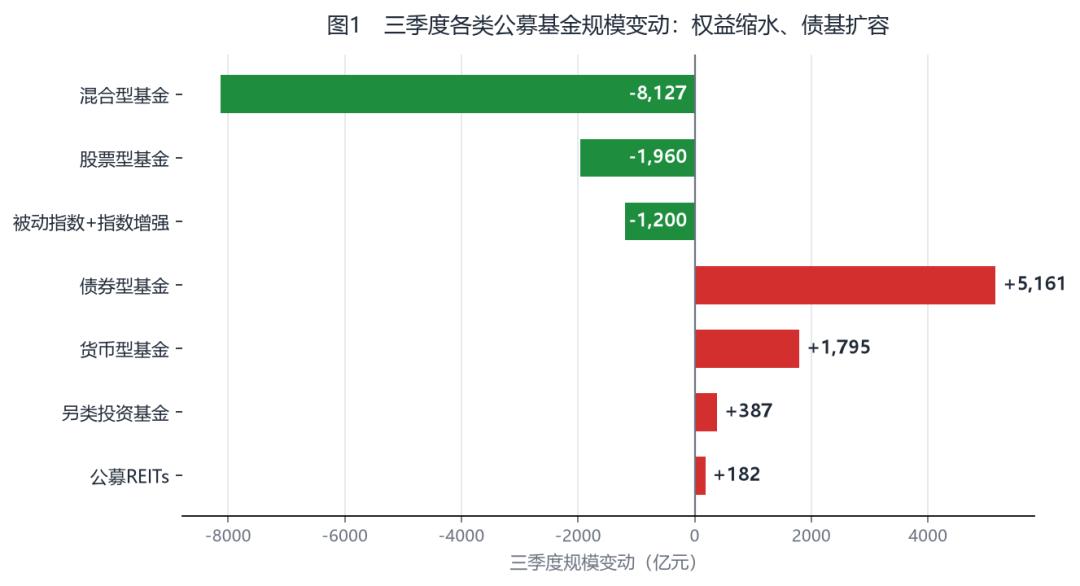
In addition, the scale differentiation of different types of funds is also particularly obvious. Among all funds in the third quarter, equity funds saw their scale decrease by about 940 billion yuan in a single quarter, and mixed funds shrank by more than 800 billion yuan. In contrast, bond funds increased by 516.1 billion yuan against the trend, which has also driven the ebb and flow of the industry landscape.
As the pointer of structural differentiation begins to move in reverse, the ranking list of public offering fund sizes is also rewritten amid this seesaw dynamic.
This is the most unmissable variable in the third quarter. (The full industry ranking is shown at the end of the article)
01 The top tier sees "stability with changes", China Merchants Fund returns to the top 10
The size ranking of the public offering fund top camp has always seemed calm on the surface but is actually surging under the surface.
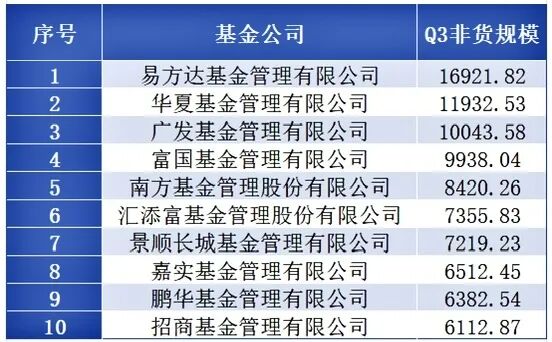
Wind data shows that by the end of the third quarter, the top 10 in terms of non-monetary fund size are E Fund, China Asset Management, GF Fund, Fullgoal Fund, Southern Asset Management, Harvest Fund, Invesco Great Wall, Harvest Fund, Penghua Fund and China Merchants Fund in order.
The rankings of the top 8 are completely consistent with those at the end of the second quarter — E Fund continues to lead with a scale of 1.692182 trillion yuan, China Asset Management follows closely with 1.193253 trillion yuan, followed by GF Fund with 1.004358 trillion yuan and Fullgoal Fund with 993.804 billion yuan.
The change occurred at the 10th place. China Merchants Fund rose from 11th to 10th place, returning to the top 10 and becoming the strongest representative of bank-affiliated funds in the industry.
The real "growth champion" in the top 10 is Southern Asset Management. Its non-monetary fund management scale increased from 780.433 billion yuan at the end of the second quarter to 842.026 billion yuan, with a single-quarter growth of 61.593 billion yuan, making it the fund company with the largest single-quarter scale growth in the entire industry. Structurally, the incremental scale of Southern Asset Management mainly comes from the growth of bond funds and ETFs.
Fullgoal Fund may also become a "disruptor" of the industry landscape. By the end of the third quarter, its non-monetary fund size reached 993.804 billion yuan, which is only one step away from the higher-ranked peers and the 1-trillion-yuan threshold. If it continues the growth momentum in the follow-up period, the top tier pattern of public offering funds may face new variables.
02 The sub-top camp is "seething under the surface", equity assets become a "burden"
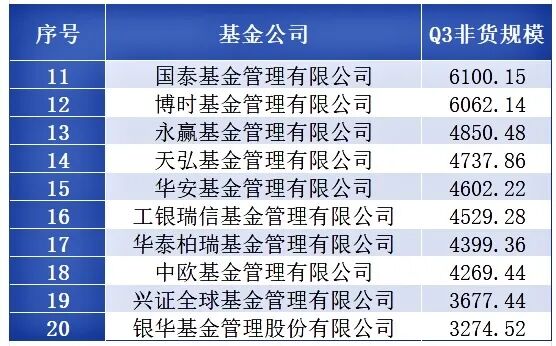
The "sub-top camp" ranked 11th to 20th is the true portrayal of the industry landscape in the third quarter.
In this range, four companies have seen their scale shrink by more than 25 billion yuan, with the maximum shrinkage reaching 49 billion yuan, and their related rankings have dropped significantly.
The "key" driving the scale change of these four companies is the performance of equity funds. On the one hand, the net value rose rapidly in the early stage, leading some investors to take profits; on the other hand, when the market pulled back in the third quarter, other investors actively exited. Driven by the two factors, the scale of popular products under the management of relevant companies has shrunk significantly.
In contrast, some fund companies have achieved rapid scale growth. The non-monetary fund scale of Tianhong Fund increased to 473.786 billion yuan, with its ranking rising from 15th to 14th; the scale of Huaan Fund increased to 460.222 billion yuan, with its ranking rising from 17th to 15th.
The performance of Huatai-PineBridge is also remarkable. Against the backdrop of most assets of companies in the same camp shrinking, the stable scale of Huatai-PineBridge pushed the company up one place in the ranking, rising from 18th to 17th.
03 The "shoulder camp" sees structural differentiation, Haifutong rises abruptly
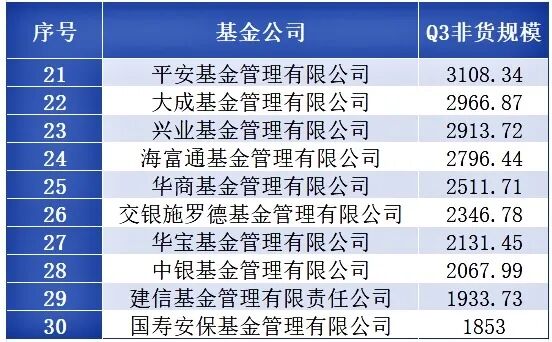
The "shoulder camp" ranked 21st to 30th presents extreme differentiation between the top and the bottom.
The top gainer is Haifutong Fund. Its non-monetary fund scale increased from 259.749 billion yuan to 279.644 billion yuan, with a single-quarter increase of 19.895 billion yuan, ranking the third in the entire market, and its ranking rose from 26th to 24th.
It is worth noting that both Haifutong and Huaan are fund companies controlled by Guotai Haitong Securities, and there have long been rumors of a merger between the two. Both of them performed strongly in this third quarter.
In this camp, the ranking of Bank of Communications Schroder and Fortune SG Fund also rose by one place respectively. Both of them have relatively stable scale thanks to their relatively diversified product line layout, which led to the rise in their industry rankings.
04 The waist camp sees "ebb and flow", the threshold for top 50 rankings has risen sharply
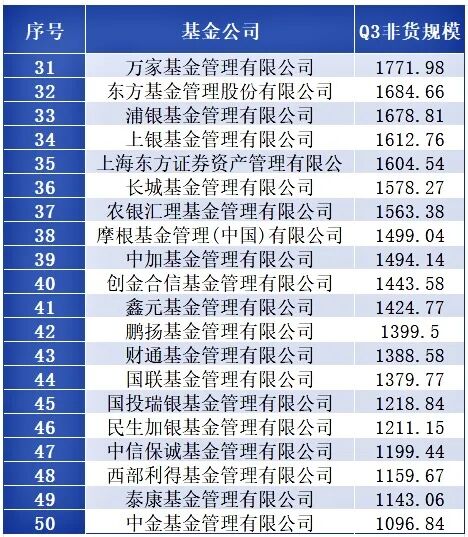
The "waist camp" ranked 31st to 50th has always been the area with the largest changes in the ranking list.
On the one hand, in this tier, the scale of each company is generally close, and their product line layout and business ideas are similar. As long as there is a slight change in the product rhythm, the ranking will be rewritten immediately.
The third-quarter report this round is no exception. Oriental Fund continued its upward momentum in the second quarter, with its non-monetary fund scale increasing from 153.448 billion yuan to 168.466 billion yuan, a single-quarter increase of 15.018 billion yuan, and its ranking rose from 37th to 32nd, making it the company with the most sharp rise in ranking in the top 50 camp.
Chuangjin Hexin Fund also performed well, with its scale increasing from 136.230 billion yuan to 144.358 billion yuan, an increase of 8.128 billion yuan, and its ranking rising from 43rd to 40th.
The scale of Penghang Fund increased by more than 10 billion yuan in a single quarter, and its ranking rose three places decisively to 42nd.
The scale of CITIC-Prudential Fund increased by nearly 19 billion yuan, with its ranking rising four places sharply to 47th.
In addition, the rankings of Wanjia Fund, ABC-CA Fund, Morgan Fund, CCB Principal Asset Management and other institutions are also rising. In contrast, some institutions that saw rapid scale growth in the first half of the year recorded obvious scale decline in the third quarter, which is closely corresponding to the performance of tech stocks.
The threshold for the top 50 has therefore continued to rise. By the end of the third quarter, the non-monetary fund scale of Jinzhong Fund, ranked 50th, was 109.684 billion yuan, which is nearly 6 billion yuan higher than the scale of about 104 billion yuan of the 50th-ranked company at the end of the second quarter.
As a result, the gap between the 50th and 51st place has expanded from less than 3 billion yuan in the second quarter to 13.66 billion yuan. The "step-crossing" battle to enter the top 50 in the future will be more difficult.
05 The "leap" and "retreat" of small and medium-sized institutions
Outside the top 50, the leap of a number of medium-sized public offering institutions is even more dramatic.
The development of foreign-funded public offering BlackRock Fund is obvious to all. In the third quarter, the company's non-monetary product management scale increased from 11.970 billion yuan to 32.520 billion yuan, with a single-quarter increase of 20.550 billion yuan, and its ranking rose from 122nd to 91st, leaping 31 places in one go, making it the asset manager with the largest ranking increase in the entire market.
Upon careful observation, the scale growth of BlackRock Fund mainly relies on several "core products": the BlackRock China Bond Preferred Green Bond Fund has continued to grow steadily in scale and net value, and its scale has reached 10.458 billion yuan in the third quarter. Another BlackRock China Bond Investment Grade Corporate Bond Fund, which also has good pullback control, has seen its scale grow to 7.63 billion yuan. Coupled with the 8 billion yuan scale brought by the newly issued BlackRock Wenli 63-month Bond Fund, the company's asset scale has been directly pushed up. From an external perspective, when the market was hot, it adhered to developing bond products with good pullback control, and the differentiated strategy brought this leap.
In addition, the scale of Caixin Fund increased from 771 million yuan to 8.836 billion yuan, leaping 25 places. Its development also relies on the completion of the fundraising of Caixin Juxin 63-month Closed Bond Fund, and the relevant product policies supporting the development of small and medium-sized funds have achieved results.
The scale of Changsheng Fund also increased by 15.06 billion yuan, leaping 10 places, which is also due to the outstanding scale performance of its fixed income products.
On the opposite side of the leap is BOC International Securities, whose non-monetary fund scale plummeted from 85.341 billion yuan to 23.305 billion yuan, with its ranking falling from 58th to 101st, dropping 43 places in a single quarter.
Of course, the scale contraction of the latter may be related to the policy-required cleanup of customized products, which is not a normal business result. The scale of BOC's own active fixed income products remains relatively stable.
Appendix: The list of public offering non-monetary fund sizes at the end of the third quarter as counted by WIND

This article is from the WeChat official account "Shishitang", author: Qin Lang, Li Zi, editor: Yuan Chang, published with authorization from 36Kr.