A new round of major reshuffling is coming for the top 10 cities ranked by GDP.
Up to now, the Q3 economic reports of the top 10 GDP cities across China have all been released.
Shanghai, Beijing, Shenzhen, Chongqing, Guangzhou, Suzhou, Chengdu, Hangzhou, Wuhan and Nanjing rank in the top 10. This list almost covers all the strong core cities in China's eastern coastal and inland regions, representing the "ceiling" of China's urban economic development.
In terms of total volume, in the first three quarters, both Shanghai and Beijing crossed the 4-trillion-yuan threshold, Shenzhen stood at the 3-trillion-yuan mark for the first time, and the combined incremental GDP of Shenzhen, Shanghai and Beijing reached nearly 700 billion yuan. In terms of growth rate, except for Chongqing, the other 9 cities outperformed the national average growth rate of 4.6%, with Shenzhen (6.0%) and Guangzhou (5.7%) leading the ranking.
Breaking down to sub-item data, Wuhan ranks first in the growth rate of value added of industrial enterprises above designated size, among which the high-tech manufacturing sector surged by 72.1%. Suzhou takes the lead in foreign trade, with its total import and export volume growing by 51.9% in the first three quarters, followed by Shenzhen with a growth rate of 38.8%. At the same time, cities including Nanjing, Wuhan, Suzhou and Tianjin are under pressure in fixed asset investment, while 6 cities including Shanghai, Beijing and Nanjing recorded negative growth in total retail sales of consumer goods.
In other words, China's top-tier cities are at a critical juncture of driving force transformation. In this transition period, the ranking of cities is reshuffled accordingly. Guangzhou is catching up with Chongqing, narrowing the gap to 86.1 billion yuan, which reignites the suspense of the competition for the 4th place. Hangzhou and Wuhan are vying for the 8th place, while Nanjing, the 10th city, is in close competition with Ningbo and Tianjin.
What is more noteworthy is that the annual full-year targets set by the top 10 cities at the beginning of the year are mostly around 5% to 5.5%. Looking at the whole year from the perspective of the third quarter, which city is expected to hit the target first?
01
In the first three quarters of this year, both Shanghai and Beijing's GDP exceeded the 4-trillion-yuan mark, reaching 4330.662 billion yuan and 4046.84 billion yuan respectively.
As the national science and technology innovation center and the region with the most concentrated high-end industries, Shanghai and Beijing recorded an economic increment of 258.545 billion yuan and 205.25 billion yuan respectively in the first three quarters, further expanding their leading advantages.
Shenzhen stood at the 3-trillion-yuan mark, achieving a GDP of 3025.085 billion yuan in the first three quarters, up 6% year on year. This growth rate leads the ranking of the top 10 GDP cities, and its economic increment reached 235.441 billion yuan, second only to Shanghai.
Behind the high growth rate, the strong pull of foreign trade is a major driving force. In the first three quarters, the total import and export volume of Shenzhen reached 4652.817 billion yuan, up 38.8% year on year, pushing the city's foreign trade dependence rate up to 153.8%.
Nationally, Shanghai, Beijing and Shenzhen not only hold unshakable positions in economic aggregate, but also in fields such as scientific and technological innovation and high-end services, forming the top tier of Chinese cities.
Below them, the competition between Guangzhou and Chongqing is even more fierce ——
At the end of 2025, Chongqing maintained an advantage of 171.847 billion yuan over Guangzhou. But by the first three quarters of this year, the GDP of Chongqing and Guangzhou reached 2571.151 billion yuan and 2485.1 billion yuan respectively, with growth rates of 4.3% and 5.7% respectively. Relying on its growth rate advantage, the economic gap between Guangzhou and Chongqing has narrowed to less than 90 billion yuan.
In terms of the industrial structure of three sectors, in the first three quarters, the growth rate of Chongqing's secondary industry was only 1.7%, and the growth rate of value added of industrial enterprises above designated size was 3.5%, ranking at the lower end among the top 10 cities. The service industry has become the strongest support for Chongqing's economic growth, with the tertiary industry growing by 5.8%, 1.9 and 4.1 percentage points higher than the primary industry and the secondary industry respectively, driving GDP growth by 3.5 percentage points.
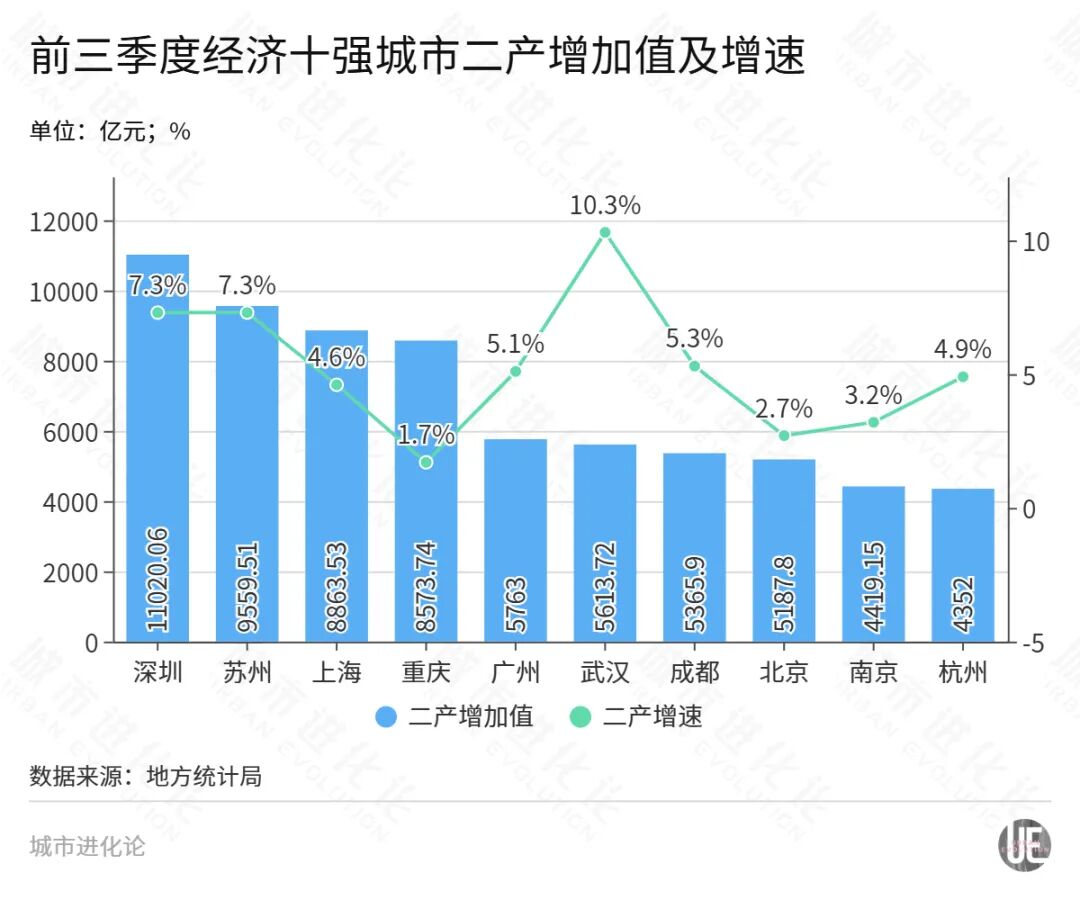
In contrast, in the first three quarters, the growth rate of Guangzhou's secondary industry was 5.1%, and the value added of industrial enterprises above designated size increased by 5.5% year on year. Specifically, among the three pillar industries, the automobile manufacturing sector grew by 5.4%, the electronic product manufacturing sector grew by 10.7%, and the petrochemical manufacturing sector grew by 5.3%.
All along, as the largest pillar industry of Guangzhou, the stable performance of the automobile industry guarantees the stable performance of Guangzhou's industry. Looking back at 2021 to 2025, the annual growth rates of value added of Guangzhou's automobile manufacturing industry were 4.4%, 6.3%, 1.6%, -18.2% and -1.6% respectively, while the annual growth rates of the city's total value added of industrial enterprises above designated size in the same period were 7.8%, 0.8%, 1.4%, -3.0% and 1.2% respectively.
At present, not only the automobile industry has stabilized. Further, the output of new energy vehicles in Guangzhou increased by 54.6%, driving the output of lithium-ion power batteries for vehicles up by 57.8%, and the value added of intelligent vehicle-mounted equipment manufacturing industry up by 37.0%.
According to Ye Shanhu, Secretary of the Leading Party Members' Group and Director of Guangzhou Municipal Bureau of Statistics, on the one hand, new industrial driving forces are taking shape at an accelerated pace. In the first three quarters, the value added of high-tech manufacturing industry increased by 10.3% year on year, and the contribution rate of advanced manufacturing to the growth of industrial enterprises above designated size is close to 70%.
On the other hand, the upgrading of manufacturing drives the coordinated development of producer services. The value added of the city's financial industry increased by 8.2% year on year, the value added of information technology service industry increased by 8.4% year on year, and the operating revenue of professional service sectors including technology promotion and application, advertising, and human resources all maintained double-digit growth.
02
Among Suzhou, Chengdu, Hangzhou and Wuhan, which all stand at the 2-trillion-yuan GDP tier, the GDP of Suzhou and Chengdu in the first three quarters reached 2119.09 billion yuan and 1942.19 billion yuan respectively, up 5.6% and 5.0% year on year, with their rankings relatively stable.
Accordingly, the competition between Hangzhou and Wuhan has lasted for several years. Especially in the past five years, the rankings of the two cities have alternated for several times ——
In 2021, Hangzhou's GDP was 39.2 billion yuan higher than that of Wuhan. By 2022, Wuhan's GDP growth rate led the top 10 cities, overtaking Hangzhou. In 2023, Hangzhou overtook Wuhan again with an advantage of less than 5 billion yuan. By the end of 2025, the GDP of Hangzhou and Wuhan reached 2301.1 billion yuan and 2214.735 billion yuan respectively, with a gap of 86.365 billion yuan.
In the first three quarters of this year, the gap between the two cities further expanded. The GDP of Hangzhou and Wuhan reached 1812.8 billion yuan and 1671.443 billion yuan respectively in the first three quarters, up 5.2% and 5.6% year on year. But the gap between the two cities rose to 141.357 billion yuan, an increase of more than 50 billion yuan compared with the end of last year.
Song Xiangqing, Vice President of the China Commercial Economics Association, analyzed to Urban Evolution that the continuous widening of the gap between Wuhan and Hangzhou does not lie in the actual growth rate, but in the different capabilities of the two industrial systems to seize the new round of AI and digital development wave.
Hangzhou's advantage lies in the formation of a three-dimensional network of "digital service industry - platform ecosystem - intelligent manufacturing". Relying on mature private capital, e-commerce and AI industrial clusters, high added value is continuously generated in software, visual intelligence, large model application and digital commerce, and the service industry has a very strong driving effect on economic growth.
The main development line of Wuhan is "hard core manufacturing breakthrough", focusing on heavy asset tracks such as optoelectronics, storage and high-end equipment. The project investment cycle is longer and the return is slower. Although the high-tech manufacturing sector has exploded this year, the chains of digital services, platform economy and business innovation are relatively short, and there is still room to improve the vitality of the private small and medium-sized scientific and technological innovation ecosystem.
It is worth mentioning that in the first three quarters, the value added of Wuhan's industrial enterprises above designated size increased by 17.5%, ranking first among sub-provincial cities. An interesting data chain shows that the industry contributes more than 60% to the city's GDP growth, the proportion of high-tech manufacturing value added has risen to 40.8%, and its contribution rate to the growth of industrial enterprises above designated size reaches 107.8%.
For example, driven by the vigorous development of the optoelectronic and chip industry in the first three quarters, the value added of the computer, communication and other electronic equipment manufacturing industry increased by 98.2%, and the output of integrated circuit wafers increased by 36.8%.
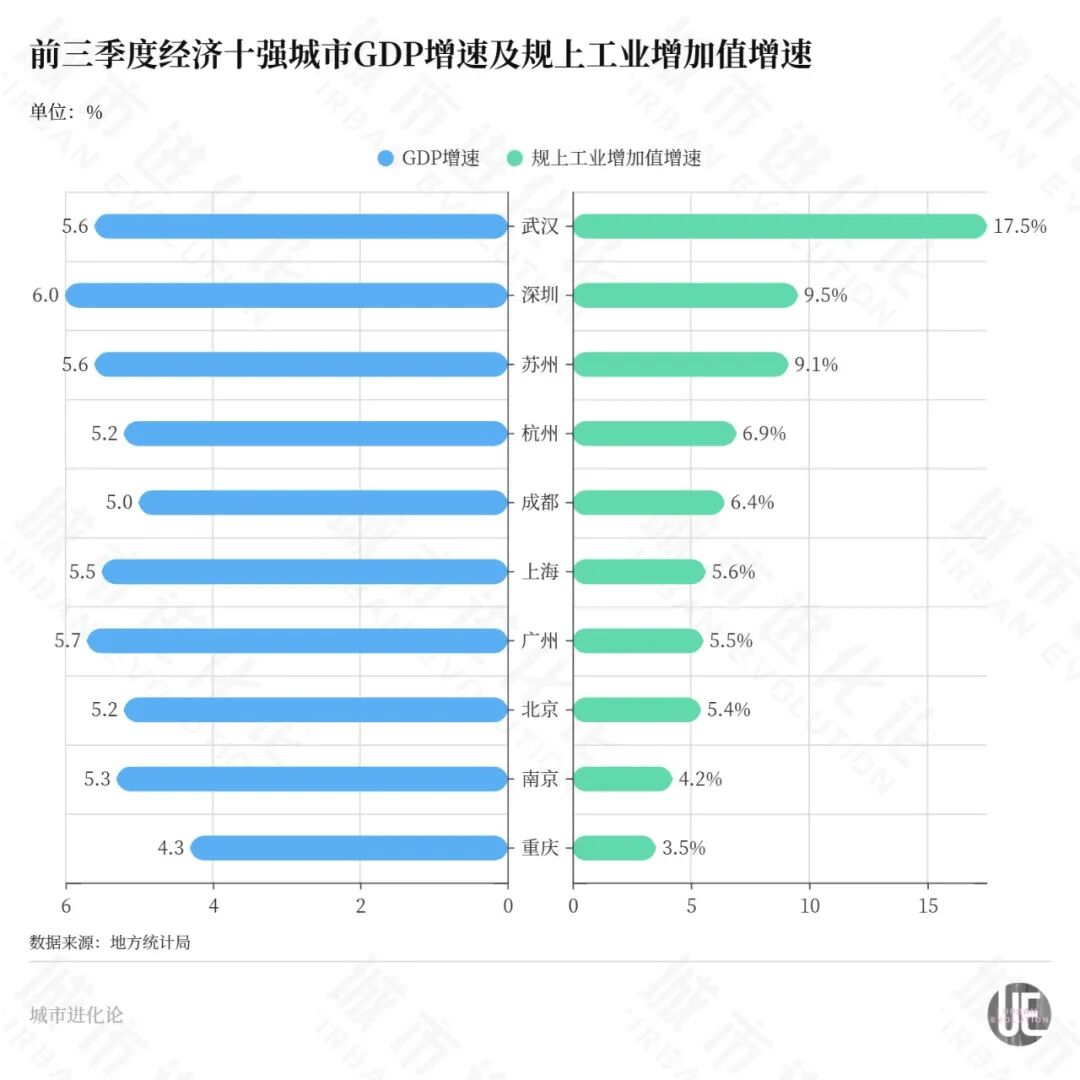
Behind this, Wuhan's high-tech manufacturing sector has for the first time exceeded the combined proportion of traditional industries such as automobile, steel, petrochemical and tobacco, completing the transformation of industrial driving forces. According to Song Xiangqing, this is a landmark achievement resulting from Wuhan's years of continuous investment in tracks such as "Optics, Chips, Screens, Terminals and Networks", integrated circuits, storage and commercial aerospace. It reshapes the city's industrial foundation, reduces dependence on commodity cycles and vehicle price fluctuations, and makes economic growth more resilient.
Hangzhou has forged modern services into its main growth engine. In the first three quarters, the value added of Hangzhou's industrial enterprises above designated size reached 364.4 billion yuan, up 6.9% year on year. At the same time, the value added of the service industry reached 1352.3 billion yuan, up 5.3% year on year, contributing 75.8% to the economic growth.
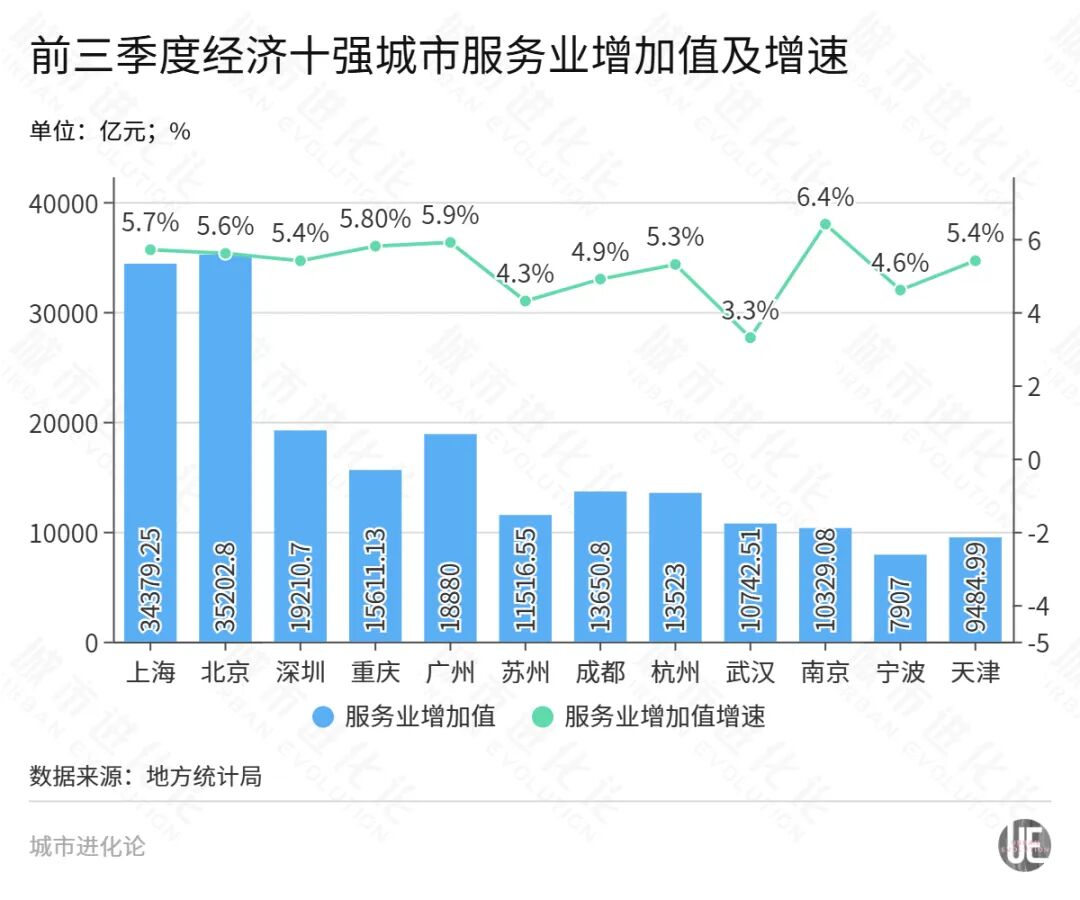
This structural trend is also transmitted to import and export. In the first three quarters, the import and export growth rates of Hangzhou and Wuhan were 15.4% and 22.3% respectively, and high-tech products in fields such as electronic information are important driving forces for both cities.
However, the decline in the investment side cannot be ignored. In the first three quarters, Wuhan's fixed asset investment growth rate decreased by 9.8% year on year, ranking the second last among the top 10 GDP cities that have released this data. Among them, real estate development investment decreased by 12.5%, infrastructure investment decreased by 13.7%, and industrial investment decreased by 9.1%.
Not long ago, the Wuhan Municipal Government held an executive meeting to analyze the economic operation in the third quarter and arrange economic work for the next stage. The meeting pointed out that "we should make every effort to stabilize investment and promote consumption, focus on the 'six networks' to strengthen project planning and application, and push the major projects of the 'five centers' to generate more tangible workload."
03
Looking further back, Nanjing still firmly holds its position in the top 10 GDP cities list.
In the first three quarters, the GDP of Nanjing, Ningbo and Tianjin reached 1495.914 billion yuan, 1443.4 billion yuan and 1410.14 billion yuan respectively, up 5.3%, 5.3% and 4.8% year on year. The three cities rank 10th, 11th and 12th in the country respectively.
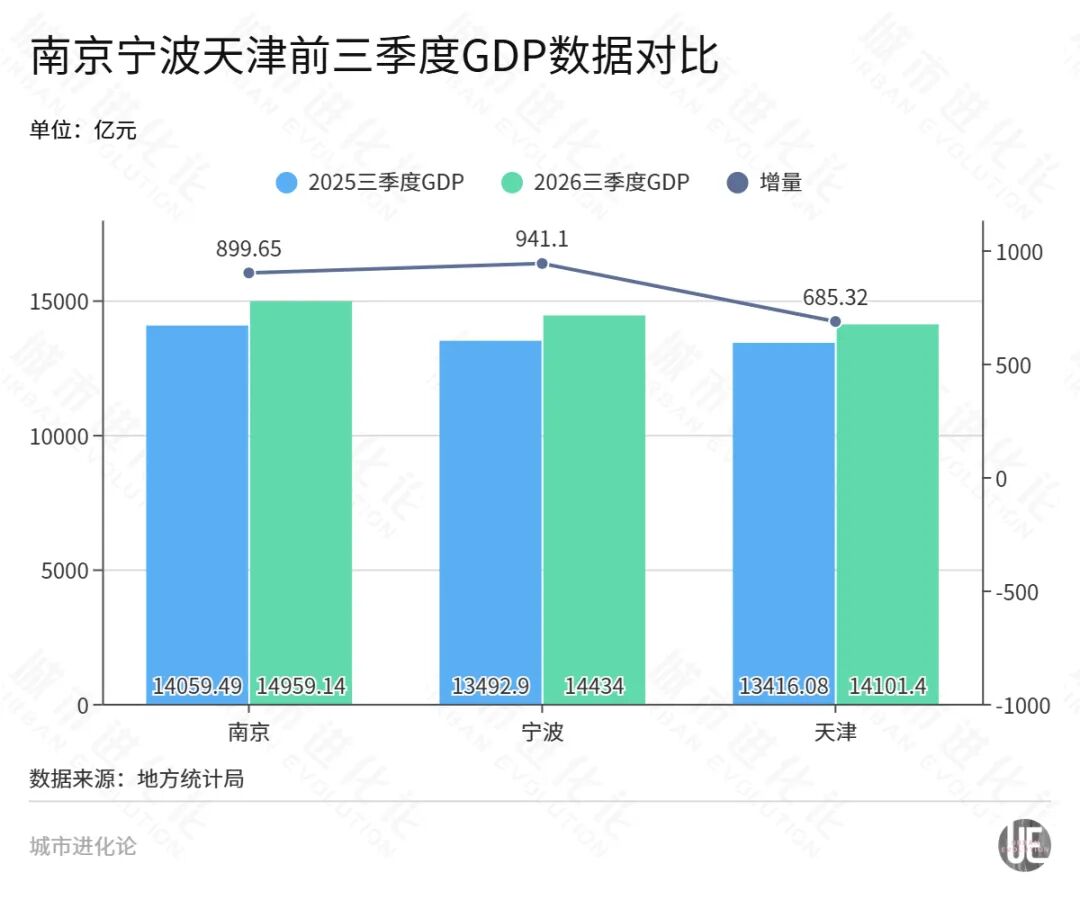
The economic gap between the three cities is kept at the level of tens of billions of yuan, which is not insurmountable. From the perspective of the "three troikas", Nanjing's advantage lies in consumption, as its total retail sales of consumer goods (609.48 billion yuan) maintains an advantage over Ningbo and Tianjin, while its import and export scale is smaller than that of Ningbo and Tianjin, even less than half of Ningbo's.
Judging from the trend of the first three quarters, all three cities are facing great downward pressure on investment, with their growth rates decreasing by 12.2%, 6.7% and 8.6% respectively. Nanjing's total retail sales of consumer goods decreased by 0.7% year on year, Ningbo's increased by 2.3%, and Tianjin's increased slightly by 0.2%. In terms of import and export scale, Ningbo's figure increased by 8.8% year on year, while Nanjing and Tianjin saw a slight decline.
As a strong contender for the top 10 list, Ningbo has surpassed Foshan, Changsha, Wuxi, Qingdao, Tianjin and many other cities since it entered the "Trillion Yuan GDP City Club" in 2017, and the gap between it and Nanjing was once only more than 30 billion yuan. Earlier (in 2021), Ningbo also put forward the goal of "striving to achieve a total GDP of more than 2 trillion yuan in 2025 and enter the top 10 in the country".
But the gap between Ningbo and Nanjing widened again in 2025 —— from 2021 to 2024, Ningbo's annual GDP growth rates were 8.2%, 3.5%, 5.5% and 5.4% respectively, all faster than Nanjing's. In 2025, dragged down by the sharp decline in real estate-related fixed asset investment, coupled with the slowdown of foreign trade growth, Ningbo's GDP growth rate was 0.3 percentage points lower than that of Nanjing, and the gap between the two cities widened again to more than 70 billion yuan.
"The gap of Ning