Short positions are approaching the five-year extreme. Why are U.S. stocks falling ever more sharply?
Why do some US companies see their stock prices keep falling even when their performance does not deteriorate significantly?
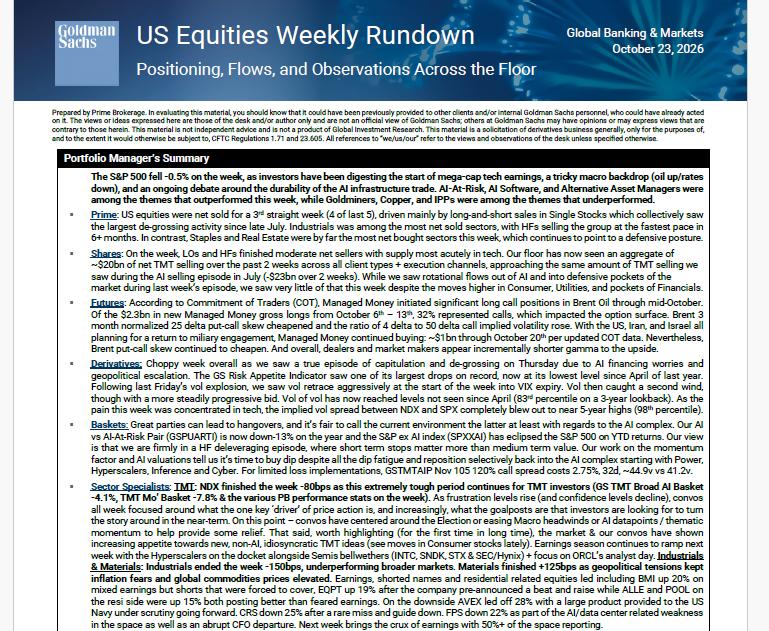
These two charts from Goldman Sachs explain part of the reason: institutions are adjusting their positions, and when a large number of funds reduce risks at the same time, the selling pressure may exceed the scope that the fundamentals of a single company can explain.
But the same positions could also make the subsequent rebound come faster. The key is to distinguish clearly what is happening now and what still needs conditions to trigger.
How concentrated is this round of selling?
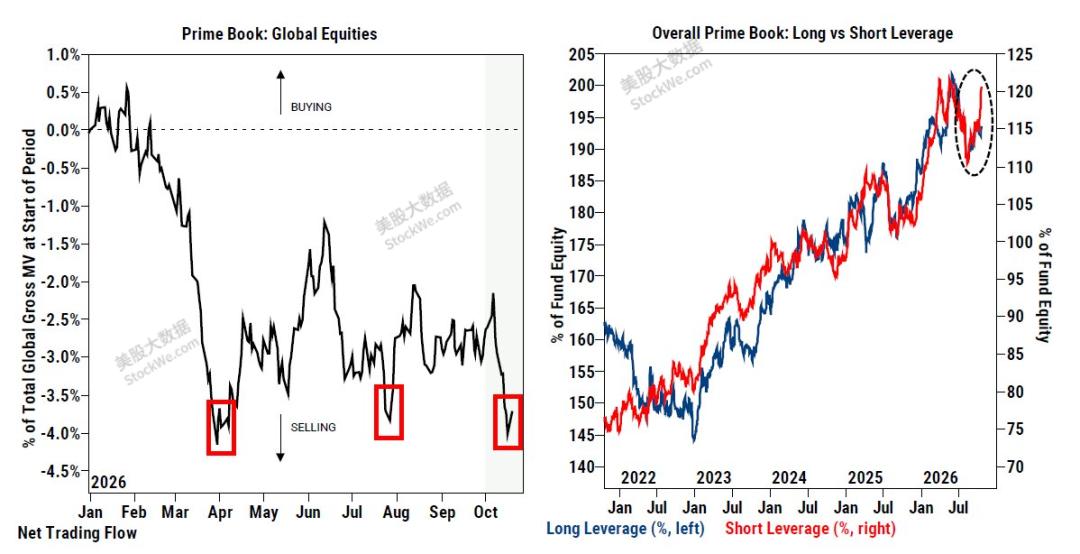
The left chart shows the cumulative net transaction flow of global stocks in Goldman Sachs' prime brokerage sample, standardized by the total market value of positions at the beginning of the period.
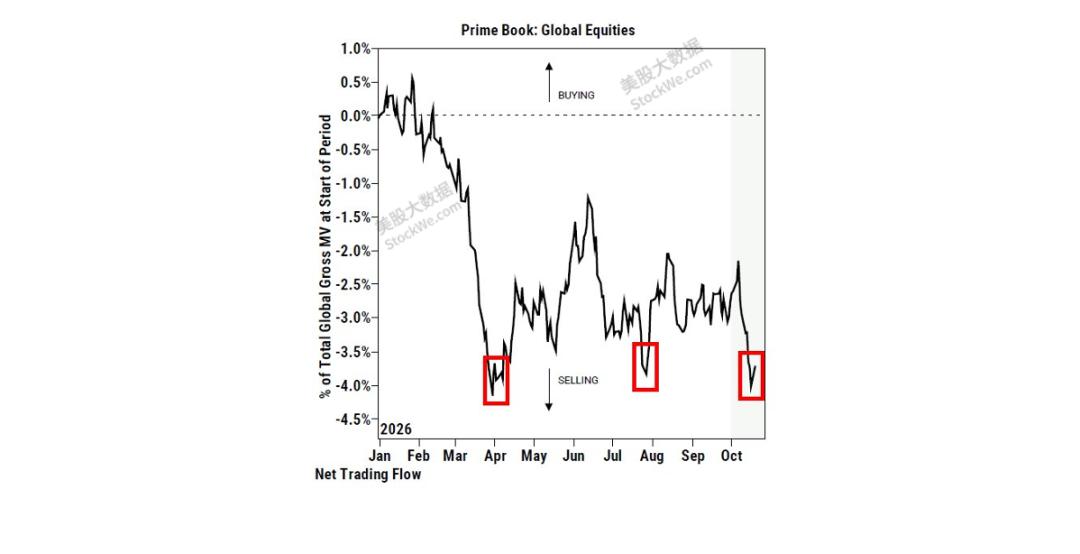
The downward movement of the black line represents net selling in this stage, while the upward movement represents net buying. The red boxes in April, August and October all correspond to obvious selling stages. The latest pulldown has once again brought the cumulative net flow close to the low point of the year.
There is a distinction to be made clear here: the position of the line reflects the cumulative result, and the steepness of the decline reflects the selling speed in the corresponding stage. Therefore, approaching the previous low cannot be directly equated with "the selling speed on that day hit a record".
At this point, you can understand why some stocks continue to face pressure even without new negative news. When a group of funds sell at the same time, good news from the company may not be able to offset the selling pressure temporarily.
This chart reflects Goldman Sachs clients' global stock trading, which cannot explain the decline of every US stock, but it reminds us: When you see your positions keep falling, don't rush to conclude that you misjudged the company. You need to distinguish whether the business has deteriorated, or the funds holding it are retreating.
Institutions still hold long positions, but their hedging protection has increased
The blue line in the right chart is the long leverage, and the red line is the short leverage, corresponding to the left and right axes respectively. They measure the ratio of the market value of long and short positions to the net asset value of the fund, and you cannot directly compare the position size by the height of the two lines.
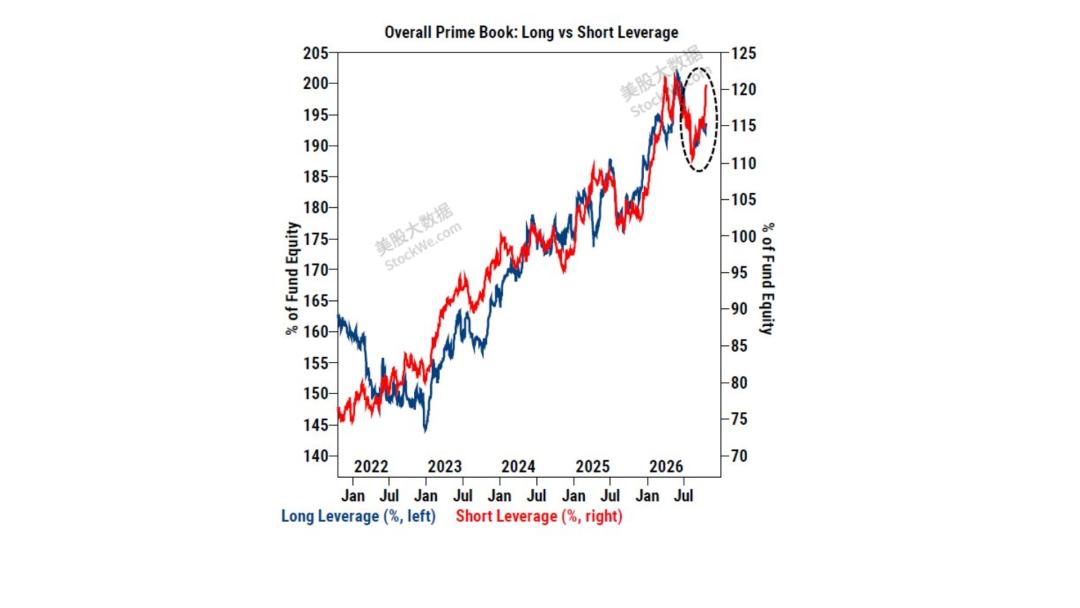
The long leverage in the chart is still at a relatively high level, while the short leverage has rebounded significantly. According to reports citing Goldman Sachs data, short leverage has reached the 99th percentile of the past five years, that is, higher than about 99% of historical observations in this period.
This does not mean that 99% of funds are bearish, nor does it mean that there is a 99% probability that the market will fall. It shows that the short exposure of the sample funds is already quite high.
These short positions may either be direct bets on the decline, or hedges to protect the remaining long positions. Institutions can be optimistic about the long-term prospects of certain companies while increasing short positions in indices or other stocks to reduce the portfolio's dependence on the rise of the broader market.
Therefore, a more accurate understanding is: Funds are still participating in the market, but their precautions against declines have been significantly strengthened.
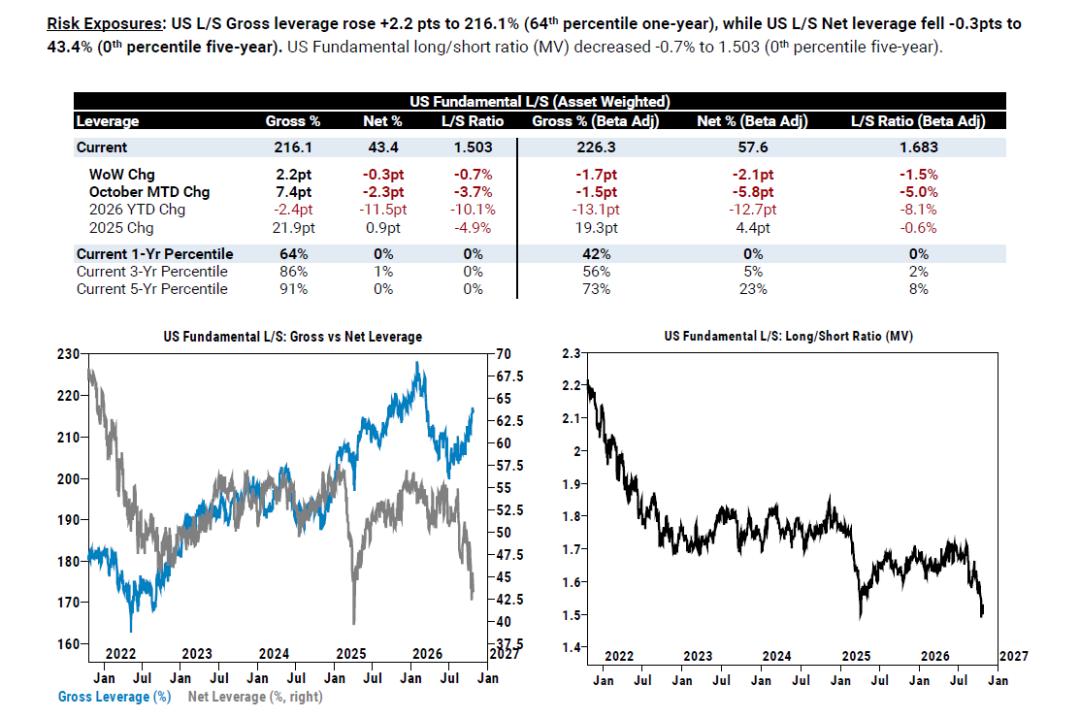
According to US stock big data platform StockWe.com, US stocks have seen net selling for the 3rd consecutive week, and the largest de-grossing at the individual stock level since the end of July has occurred.
Capital has taken an extremely defensive stance, frantically selling off technology (TMT) and industrial stocks, while buying a large amount of consumer staples and real estate (recording the largest buying volume in 5 years).
This means that market sentiment is extremely cautious, and hedge funds are rapidly cutting their risk exposure.
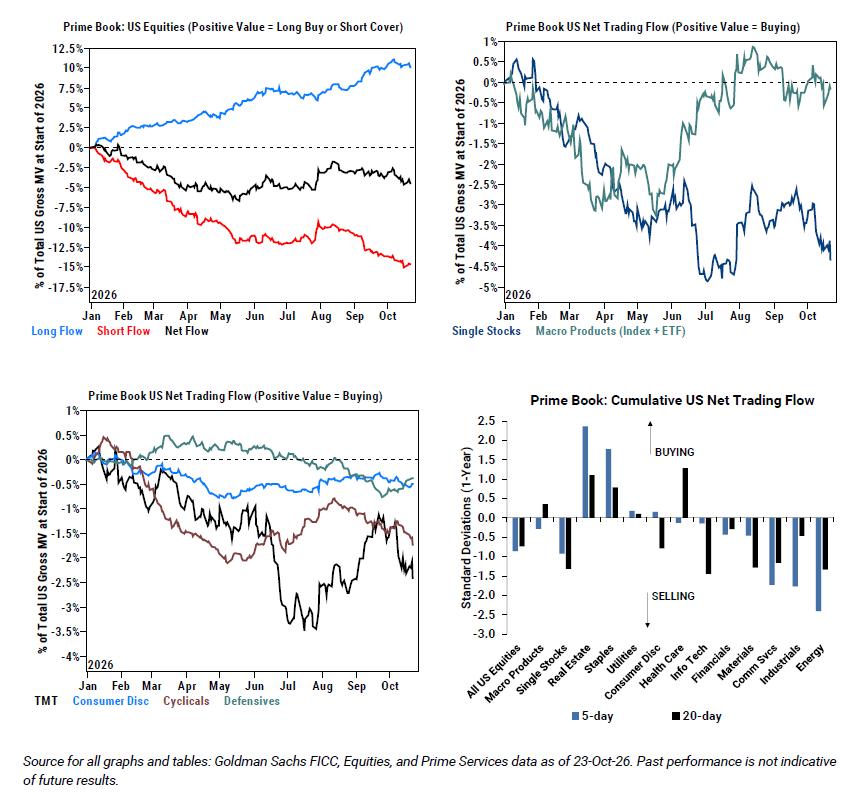
In the past two weeks, the TMT sector has seen a net outflow of about 20 billion US dollars, approaching the extreme scale of the large AI sell-off in July (23 billion US dollars). This is a typical deleveraging phase for hedge funds, where short-term stop-loss actions override medium-term fundamental value.
Goldman Sachs judges that despite the severe "buy-the-dip fatigue" in the market, now is the time to buy on dips, and it recommends selectively overweighting power utilities, hyperscalers, inference and cybersecurity sectors.
For the more complete in-depth report: StockWe.com/col/depthreport
Why are good companies sold off together?
When funds suffer losses, volatility rises, or hit internal risk limits, what managers first need to address is often the risk of the entire portfolio.
At this time, even if a company has just released good financial reports, it may still be sold. The reason may not be that the fund suddenly denies its value, but that the position is too concentrated, leverage needs to be reduced, or cash must be freed up.
According to Reuters reports, on October 22, the fundamental long-short, systematic and multi-strategy funds tracked by Goldman Sachs all lost more than 1% on that day; losses from crowded AI trades also pushed some funds to reduce leverage and risk exposure.
This kind of adjustment will amplify market movements: price declines bring losses, losses prompt funds to reduce positions, and position reduction creates new selling pressure. For retail investors, the most uncomfortable part is that the stock price still faces pressure even without new negative news from the company.
However, we cannot attribute all declines to institutions, nor can we infer that funds are deliberately smashing the market to recover losses through short selling.
US Stock Investment Network believes that this round of decline needs to be viewed from two layers at the same time: Concerns such as returns on AI investment and rising financing costs affect the valuation that investors are willing to give; institutional position adjustments may further amplify the decline. The two can happen at the same time.
Why can a large number of short positions also amplify the rebound?
After shorting stocks, investors usually need to buy back the stocks to close their positions. If the stock price starts to rise continuously, short sellers will face losses, and some funds may choose to cover their positions.
When covering happens in a concentrated manner, buying pressure will increase, pushing the price up further, which in turn forces more short sellers to re-evaluate their positions. This is why some stocks that have fallen sharply can also rebound very fiercely.
However, a large number of short positions only means there is potential covering demand, not that buying pressure will appear immediately. Funds can maintain their short positions, or rebuild their short positions after closing them. Without sufficient positive news, crowded positions may well last for a period of time.
What is really worth observing is: after positive news comes out, can the stock price hold its gains; after short covering, are there still funds willing to hold positions for the long term that continue to buy. If only the former exists, it is easy to see repeated fluctuations after a sharp rise; when both appear, the rebound will be more sustainable.
My judgment is that these two charts raise our vigilance against a sharp market rebound, but they are not enough to confirm that the bottom has been reached. They more directly remind us that the current price fluctuations include the impact of institutional position adjustments, and cannot all be regarded as changes in the long-term value of the companies.
I remain positive about the long-term demand for AI infrastructure, but this confidence must be implemented in specific companies: whether customers continue to make purchases, whether projects can be delivered, and whether financing can hold up. Even if the industrial direction is promising, we need to distinguish which companies can retain their growth.
Moving forward, we need to guard against further position reduction by institutions, but also do not conclude that all opportunities have disappeared just because of consecutive declines. First judge whether the company you hold has really deteriorated in business, or is mainly impacted by valuation and position adjustments, and then decide on your next operation.
This article is from the WeChat Official Account "US Stock Investment Network" (ID: tradesmax), author: StockWe.com, published with authorization from 36Kr.