Gold has plummeted by 27%, silver prices have been cut in half, is a larger precious metal crisis brewing?
Gold has fallen by more than a quarter from its January high, and silver has plunged by over half. On the surface, this is nothing more than a natural cooling of an overheated market. But behind the price decline, the structural imbalance in the physical market has not been repaired at all; instead, it has continued to deteriorate — central banks made record gold purchases in the quarter when gold prices dropped 14%, and silver has recorded supply deficits for six consecutive years with the gap further widening. The rift between prices and physical supply and demand is becoming increasingly impossible to ignore.
After hitting an all-time spot price peak of $5,608 per ounce in January 2026, gold headed downward, falling to roughly $4,112 by mid-October, down about 27% from its peak. After briefly touching $121.62 on January 29, silver immediately halved in value and is now trading near the $56 level. Meanwhile, data from the World Gold Council shows that global central bank gold purchases in Q2 2026 reached 288.9 tonnes, the highest level on record for the same period, surging 62% year-on-year — and this occurred exactly during the quarter when gold prices dropped 14%, running completely counter to the behavioral pattern of capital that chases rising prices.
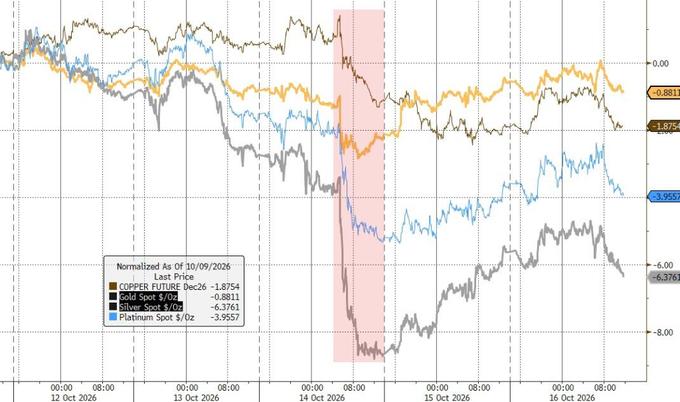
The physical silver market is also sending abnormal signals. According to the Silver Institute's *World Silver Survey 2026*, the global silver market is expected to record a supply deficit of 46.3 million ounces in 2026, further expanding from the 40.3 million ounce deficit in 2025, marking the sixth consecutive year of shortfalls, while mine supply has barely seen any growth. Prices have plummeted by 53% yet the deficit has risen rather than narrowed — this combination cannot be explained by an ordinary commodity correction.
01
The paper market has averted a run on positions, but the physical market has not healed
To understand what exactly this decline has changed, we need to go back to what happened in the London market this January.
Silver prices once surged 25% in two weeks, pushing the gold-silver ratio below the historically rare extreme level of 45. Silver touching the all-time high of $121.62 did not come from a gradual revaluation of prices, but from a classic short squeeze: the physical silver lease rate spiked sharply, the forward curve inverted, and the "exchange-for-physical spread" between the London OTC market and the New York futures market widened significantly — which meant the two markets were temporarily giving completely different pricing for the same metal.
The squeeze then disintegrated as scheduled. High prices accomplished three things at the same time: suppressing marginal demand, attracting new short positions to enter the market, and theoretically prompting holders to release inventories. However, according to analysis, during the 2026 squeeze, the first two mechanisms operated weakly: solar manufacturers and connector makers would not halt production just because raw material prices rose by 30%, and private holders in Asia mostly stayed put. What truly pushed down prices was "paper selling" in the futures and options markets. Physical metal did not become more abundant, and two months later, the full-year deficit forecast was even further revised upward.
This logic determines the nature of this correction: the decline has washed out speculative positions, rather than the supply and demand gap itself. The floating physical inventories in the London market have not been replenished.
02
Central banks: the hand that accelerates buying amid the decline
Central banks increasing their gold holdings is not newsworthy in itself. What is truly worth paying attention to is the composition of buyers, their behavioral patterns, and their impact on market structure since 2022.
The 9th World Gold Council Central Bank Gold Reserve Survey 2026 shows that 89% of central bank officials expect global gold reserves to continue rising over the next 12 months, and 45% of surveyed institutions say they will expand their positions — the latter figure hits a record high. A concurrent HSBC survey of reserve managers shows that roughly 40% of respondents plan to increase their holdings, most of whom explicitly state that the current price level will not deter them. Among the reserve management group that is usually known for buying on dips, this orientation of "continuing to increase positions regardless of price" is one of the most obvious structural shifts in recent years.
Morgan Stanley research shows that gold's share in global central bank reserves has exceeded that of US Treasury bonds for the first time since 1996. Institutions in Poland, Turkey, India, Singapore, and multiple Gulf and Central Asian countries have all increased their holdings. This trend is not ideologically driven, but is closer to active defensive position adjustment by reserve managers of various countries after witnessing the freezing of Russian reserves.
One impact that is often underestimated is that official reserve gold hardly flows back to the market. It is estimated that the available floating inventory in the London physical market is between 3,000 and 4,000 tonnes, and a net absorption of 289 tonnes in a single quarter is equivalent to siphoning off about 8% of tradable stock, and this portion of metal will not flow back to the market at market prices. It should be noted that the aforementioned floating inventory figure is an estimate, not publicly disclosed data, and should be treated as an order-of-magnitude reference rather than an accurate measurement.
Of course, there is considerable uncertainty in the data itself. The World Gold Council sharply revised down central bank gold purchases in Q1 2026 from the initial estimate of 244 tonnes to 57 tonnes, with a revision range close to 80%. The credibility of single-quarter data is limited, but the directional trend that spans four years and is cross-verified by multiple sources will not be overturned by a single data revision — those institutions that have stated they will continue to increase their holdings have not stopped their actions so far.
03
Silver: a metal that is being "completely consumed" by industries
The predicament of silver is fundamentally different from that of gold in mechanism, and therefore has deeper significance.
Once mined, gold remains in the world almost permanently — in bars, coins, jewelry, official vaults, and ETFs. The "deficit" in the market is essentially a redistribution among holders, not an absolute shortage, and the metal can always be found at a certain price. Silver is different. 50% to 60% of its annual industrial consumption goes into finished product manufacturing — solar panels, high-speed connectors, automotive sensors, server motherboards — where silver in units of grams or even milligrams is permanently dispersed, and is usually not economically recoverable when the products are scrapped. This means that every year the silver market irreversibly converts part of the metal with monetary attributes into industrial products. Over years and years, the monetary stock available for squeezing is getting smaller and smaller — this is exactly the structural background behind prices briefly breaking through $121 and the gold-silver ratio collapsing below 45 this January.
The largest single industrial end market for silver is photovoltaics, which consumed 186.6 million ounces of silver in 2025. Affected by iterations in cell technology (thinner silver paste wires, alternative metallization routes), silver consumption for PV dropped 6% in 2025, and is expected to fall another 19% in 2026 to roughly 151 million ounces, marking the largest annual decline on record. Normally, with the largest demand end shrinking by 19%, the market deficit should have narrowed — but the opposite is true, and the 2026 deficit forecast has further expanded.
What fills the gap left by reduced PV demand is the rapid expansion of data center construction, high-voltage transmission equipment, electric vehicles and charging infrastructure, power grid renovation and other sectors. The common feature of these application scenarios is that the functionality of silver is irreplaceable. PV can be redesigned to reduce silver usage, but there is hardly any alternative space for silver sintered power modules in high-voltage switch contacts and server racks — because silver's electrical conductivity here is a functional requirement, not a decorative attribute. The market reality in 2026 is: the 35 million ounces of demand lost from PV has been replaced by demand that is less substitutable and more scattered across application scenarios, pushing the deficit higher instead of lower.
04
Supply side: a market that takes a decade to respond
Prices should normally call forth new supply. In the silver market, this mechanism has almost failed.
Ore grades in major producing regions have continued to decline for decades, and energy consumption and capital investment required to extract the same output have risen significantly. The environmental approval cycle has exceeded ten years in multiple jurisdictions. Financing costs are far higher than levels in the 2010s, raising the threshold for projects and eliminating marginal mines. Even so, after two rounds of capital discipline rectification, mining companies holding cash are not necessarily willing to expand production.
The expansion cycle on the demand side is vastly different: a data center can be put into operation 18 months after financing, a photovoltaic power station can be connected to the grid within a year, and an electric vehicle production line can be renovated within two years. The expansion cycle of industrial consumption is roughly one-fifth of that of the supply side.
The prudence of mining executives has its inherent logic: the 2026 price spiked and then halved within 18 months, which is the worst possible price signal — it encourages overinvestment at the peak and then punishes it immediately. Keith Neumeyer, CEO of First Majestic Silver, has publicly stated many times that silver should trade between $100 and $200 per ounce, and repeatedly warned in interviews with Kitco News: "One day the market will wake up with a jolt and find there is no silver left to buy."
05
Trade policy: a trigger that has not been pulled yet
Geopolitics and trade policies have added extra vulnerability to the physical market.
In November 2025, silver and platinum group metals were added to the U.S. Geological Survey's critical minerals list, triggering a national security investigation under Section 232 of the 1962 Trade Expansion Act. The market immediately began pricing in silver import tariffs — the direct consequence of this move is that metal will be absorbed into U.S. warehouses, the available floating inventory in London will further shrink, and the physical delivery spread will widen again, replicating the 2021 London metal drain that nearly endangered the futures delivery mechanism.
On January 14, 2026, the U.S. President issued a proclamation deciding not to impose tariffs on refined critical minerals and their derivatives for the time being, and requiring relevant agencies to advance trade negotiations. Silver had previously been excluded from the reciprocal tariff list.
In other words, the world's largest economy has established a policy mechanism that can redirect global silver flows at any time, which has not been activated yet. Once triggered, it will repeat the 2021 liquidity shock in a market with smaller floating inventories and six consecutive years of deficits — and the initial conditions will be even more fragile.
06
Fiscal debt: the most enduring macro foundation for precious metals
All of these are superimposed on an increasingly stressed fiscal backdrop.
According to estimates from the U.S. Committee for a Responsible Federal Budget, the U.S. federal deficit for FY2026 will reach roughly $2 trillion, with interest expenditures of about $1.1 trillion, accounting for 3.4% of GDP, a new all-time high, making it the second-largest expenditure item in the federal budget, exceeding defense and Medicare spending. The Congressional Budget Office projects that net interest expenditures as a share of GDP will climb from 3.3% to 4.6% in 2036.
The correlation between precious metals and fiscal deficits is not the simple logic that "deficits cause gold prices to rise" — the short-term correlation between the two is not stable. A more convincing narrow proposition is: A government facing rising interest rates and slowing growth has extremely limited room for policy tools — tax hikes harm investment, spending cuts may trigger a recession, and borrowing only delays the pressure. The remaining option in the end is often the gradual erosion of the purchasing power of the currency. The asset that hedges against this risk is exactly the physical metal that has no counterparty.
Ray Dalio's statement at Davos in 2020 that "cash is trash" is no longer just a sensational maxim six years later, when the share of interest expenditures in GDP continues to rise.
07
Three potential outcomes
Combining the above factors, this situation has three evolutionary paths:
Orderly revaluation. Gold and silver trend higher with fluctuations over several years, with occasional corrections similar to the one in 2026; mining investment finally responds, new supply comes online in the early 2030s, the deficit gradually narrows, and precious metals stabilize at a higher price platform. This is the most gentle scenario and the one with the highest probability based on existing evidence. It does not require any new catalysts, only continued central bank purchases and continued growth in industrial demand — and both conditions are currently on track.
Disorderly squeeze. Tightening tariff policies, policy mistakes or sudden inventory consumption trigger another round of squeeze similar to the one in January — but this time the market has smaller floating inventories and thinner dealer balance sheets. Prices overshoot sharply, forcing industrial consumers to purchase regardless of price, and the shock transmits down the supply chain to manufacturing costs, component prices and end consumer goods. This scenario does not require any new development, only a repeat of an event that has already happened once.
System breakdown. Broader monetary or fiscal events — failed Treasury auctions, currency crises in large emerging economies, disorderly repricing of sovereign debt — force a step change in the reserve system. Gold prices multiply several times, official buying turns into a certain degree of panic buying, and the current reserve system architecture is formally rather than informally abandoned. This is the scenario with the lowest probability but the most far-reaching consequences, and the moment when the term "precious metals crisis" truly gains its full weight.
Supporting this overall judgment are three mutually independent pillars: sovereign buying, physical deficits, and fiscal deterioration. All three need to collapse at the same time for the argument to be falsified — and current signs show that none of them is visibly shaking.
This article is from the WeChat official account "Wall Street CN Max", author: Zhang Yaqi, published with authorization from 36Kr.