Bank of America: The burst of the AI bubble may trigger a simultaneous decline in U.S. stocks and U.S. Treasury yields, and the OpenAI revenue incident has already served as an advance preview.
The derivatives team at Bank of America warns that when the AI bubble finally bursts, the market will move in a drastically different pattern from what we have seen in the past months — it will not be a "stocks down and bonds down" scenario (falling stock prices and rising U.S. Treasury yields), but a synchronous decline in stock prices and yields.
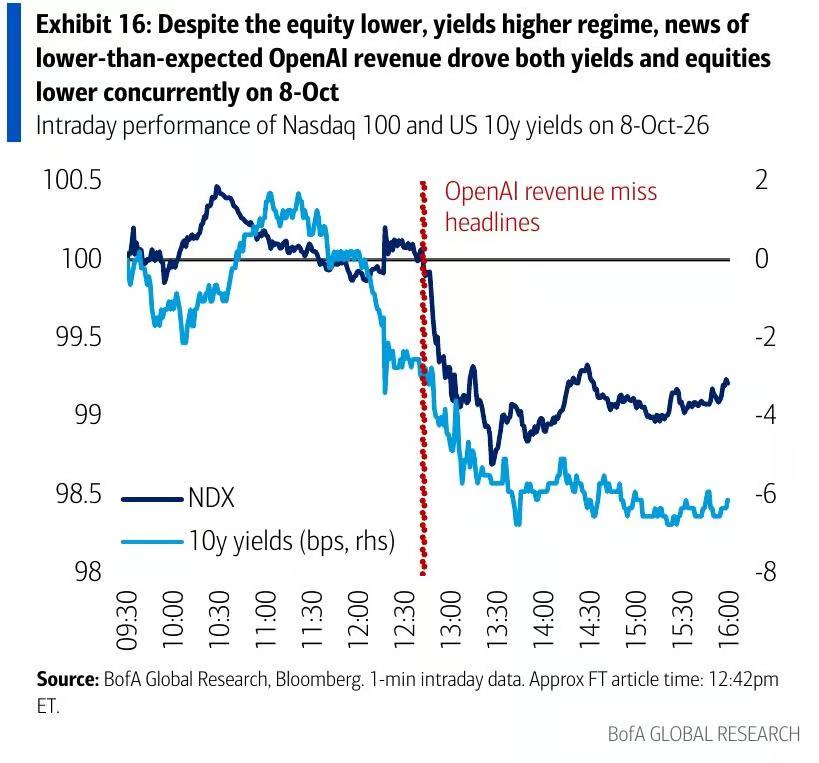
On October 8, the UK's Financial Times revealed that OpenAI's annualized revenue is far lower than the figures circulated in the market. On the same day, the Nasdaq Index plunged by more than 1%, the Philadelphia Semiconductor Index fell by 3.4%, and U.S. Treasury yields also moved lower immediately — the bond market showed a rare risk-averse property.
In the latest issue of the Global Equity Volatility Insights report, the Bank of America derivatives team defined this single-day flash crash as "the best rehearsal for AI position unwinding", and pointed out that a more critical signal lies in: U.S. Treasury yields moved down synchronously with the stock market at that time, instead of the "stocks down and bonds up" pattern that the market has been accustomed to for months.
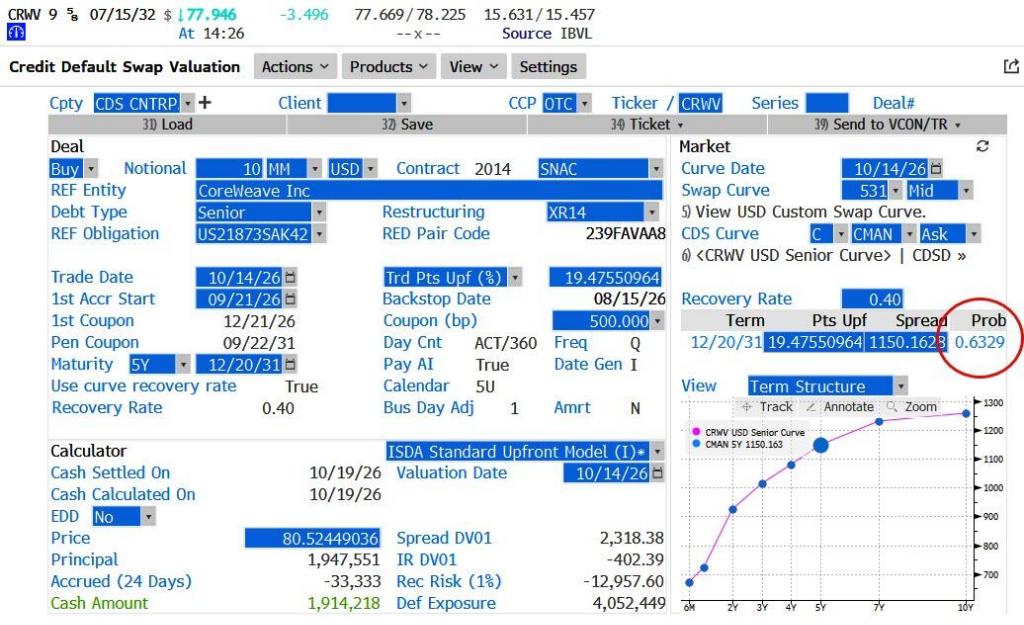
This pattern was then replicated on October 14. On that day, U.S. CPI inflation data exceeded expectations, the 10-year U.S. Treasury yield once surged, and the probability of interest rate hike expectations briefly broke through 50%. However, as the share price of cloud computing infrastructure enterprise CoreWeave plummeted by more than 15% and the credit default swap spread widened by 135 basis points, the upward trend of bond yields reversed rapidly, and the yield finally closed nearly flat.
On the 15th, the 10-year U.S. Treasury yield continued to fall sharply by 10 basis points to 5.09%, touching a three-week low. At the same time, the MSCI Asia Pacific Stock Index plunged by more than 3%, the Korea Composite Stock Price Index once plummeted by 9% in a single day, and the declines of Samsung and SK Hynix once reached double digits. S&P 500 futures fell 0.4%, and Nasdaq 100 futures fell by more than 1%.
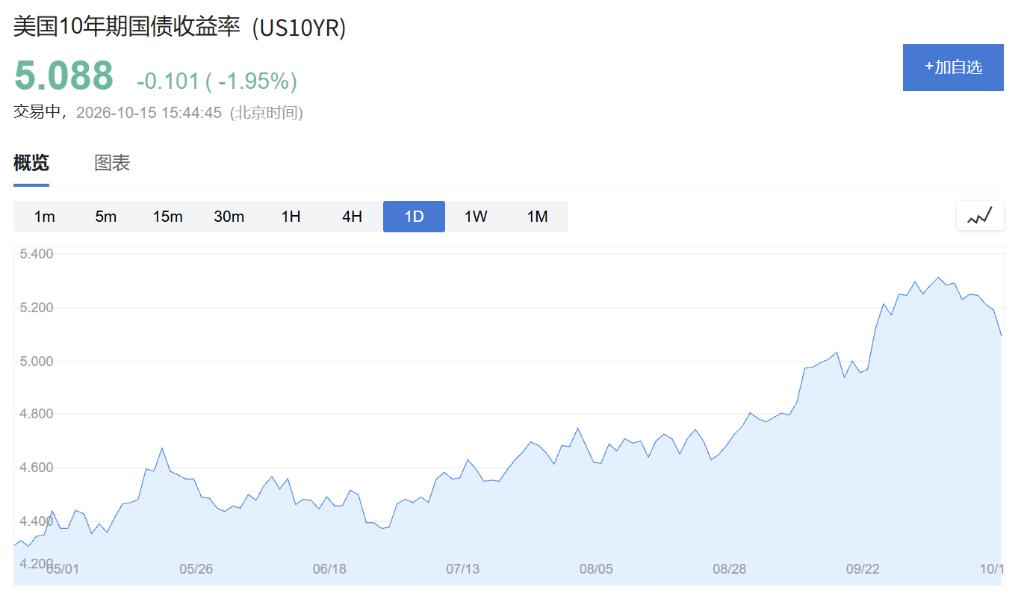
Bank of America believes that this is exactly the "transmission chain" of the AI bubble burst: The pressure from the private AI ecosystem hits the Nasdaq first and most violently, and pulls the bond market into risk-aversion mode at the same time.
AI-specific risk shocks, Nasdaq bears the brunt
Benjamin Bowler, Nitin Saksena, Arjun Goyal and other members of Bank of America's equity-linked team pointed out that the Nasdaq's significant underperformance relative to the broader market on October 8 is highly consistent with the performance of every AI-specific risk event in the past few years — from the DeepSeek shock in January 2025 to the semiconductor sector correction this summer, the pattern is identical.
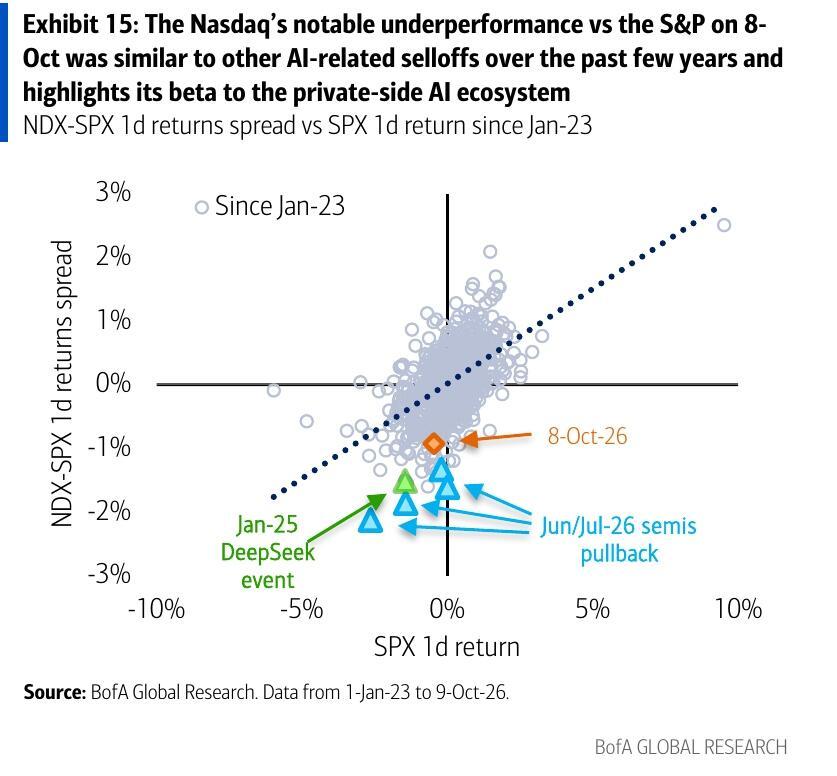
The report believes that this reflects the Nasdaq's high exposure to the "private AI ecosystem". Once cracks appear in private AI companies such as OpenAI and Anthropic, the Nasdaq 100 Index will be the first underlying target to bear pressure in the public market. The bank defines it as the preferred index for AI trading, whether long or short.
This transmission path is now facing a new stress test. Anthropic opened its financial data to Wall Street on October 14, while the $20 billion "gap between total revenue and net income" of OpenAI remains unresolved, and the transmission channel from the private sector to the public market is expected to continue to be tested.
Abnormal bond market movement: Both AI shocks trigger synchronous decline in yields
What deserves more attention is the behavioral pattern of the bond market. In the past few months, U.S. stocks and U.S. Treasury yields have continued to show an inverse relationship, and the function of bonds as a hedging tool has almost failed. However, the two AI risk events on October 8 and October 14 both broke this pattern, with yields moving lower in step with the stock market.
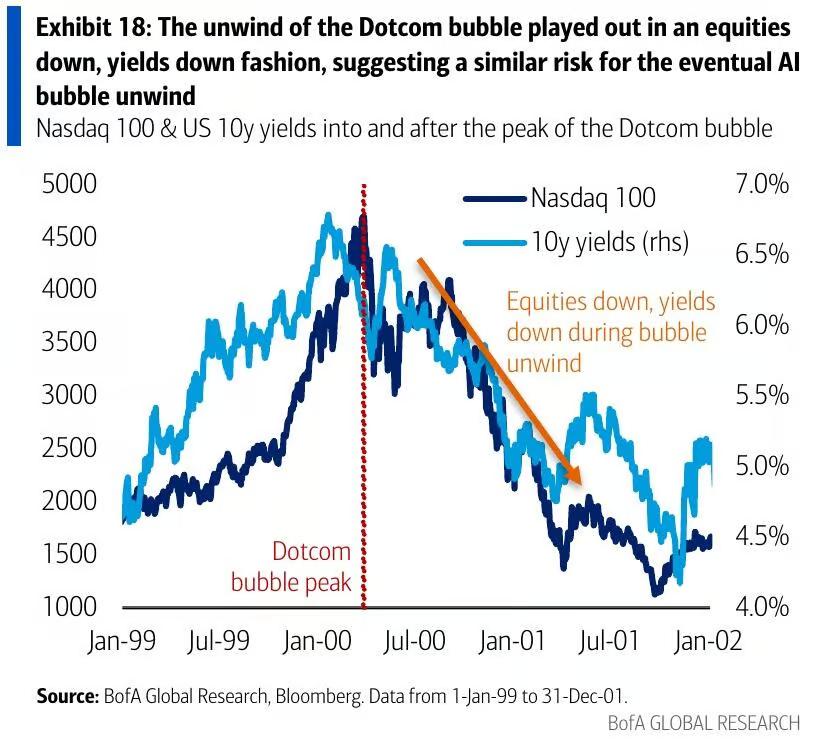
Bank of America attributes this to the macro logic of AI slowdown: In addition to the inflow of traditional risk-averse capital, the cooling of the AI investment cycle means reduced capital expenditure, lower power and resource consumption, coupled with the dual suppression of economic growth and inflation, which will form additional positive factors for bonds. In other words, if the AI bubble really bursts, bonds will resume their hedging function.
The historical reference cited in the report is the burst of the dot-com bubble in 2000: At that time, the Nasdaq 100 Index crashed, and the 10-year U.S. Treasury yield fell from about 6.5% to the mid-4% range. Bank of America acknowledges that the two data points do not yet constitute a complete pattern, but believes that the mutual verification of historical precedents and macro logic is sufficient to provide structural references for investors.
CoreWeave triggers credit-side crisis, AI stocks underperform broader market by 840 basis points this week
The market sell-off on October 14 revealed another potential burst path for the AI bubble: the credit side.
CoreWeave (CRWV) is the center of this storm. After the G-spread of its 2032-maturity bonds broke through 1000 basis points and the yield rose to 15%, its share price then plummeted by more than 15%, marking the third largest single-day decline since its listing. D.A. Davidson analyst Gil Luria defined CoreWeave as the "subprime mortgage tranche" in the AI field, and warned that if the company cannot repay its debts, its share price will go to zero — its financing cost is about 9%, while the return on investment is only about 1%. CoreWeave's credit default swap spread widened by 135 basis points on the same day, and the current market-implied default probability within five years has reached 63%.
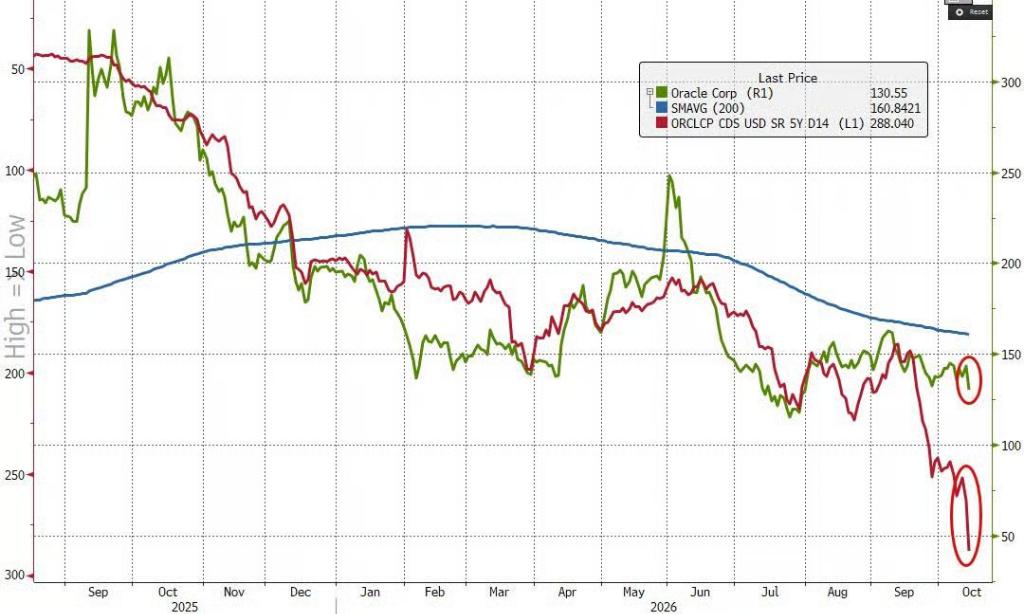
Panic spread rapidly. DigitalOcean (DOCN) fell 14%, Hut 8 (HUT) fell 10%, Nebius (NBIS) and IREN each fell by about 9%; Oracle (ORCL) fell 9%, and the deviation from its credit default swap level has not been closed. Market research firm Gartner then issued a warning, predicting that 80% of emerging cloud computing enterprises will cease independent operations before 2030.
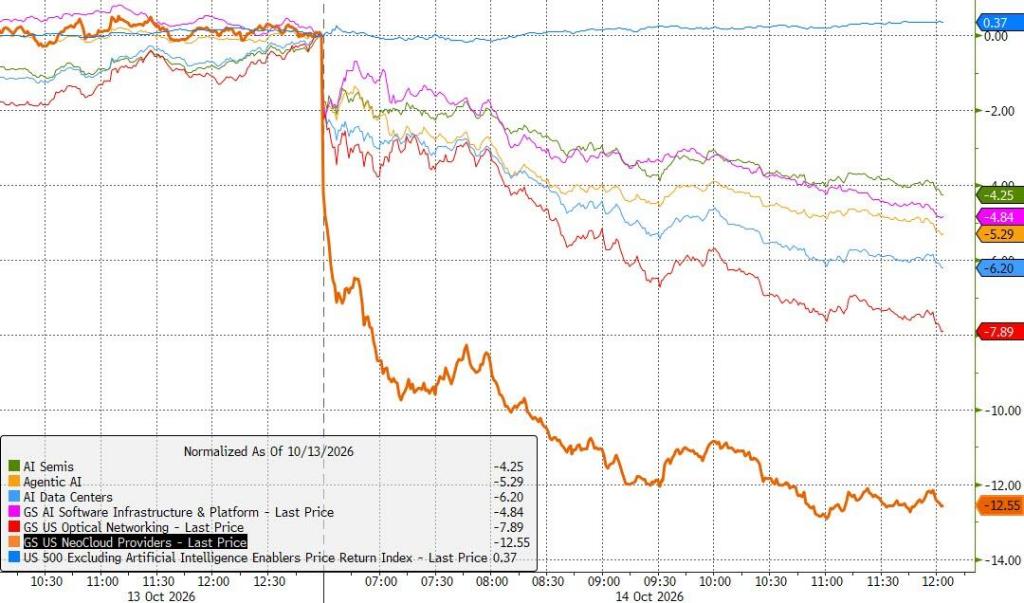
This week, the cumulative underperformance of the AI sector relative to non-AI constituents of the S&P 500 has reached 840 basis points. BTIG strategist Jonathan Krinsky also believes that the current pain trade points to "falling interest rates and falling Nasdaq". If the "Magnificent Seven" also begins to fall synchronously with interest rates like semiconductor stocks, it will further confirm his "Red October" judgment.
BofA recommends hedging portfolio: Let the bond market subsidize option costs
Faced with this potential risk, Bank of America's derivatives team has proposed a hedging structure of "using bond proceeds to offset equity hedging costs".
The difficulty of traditional AI bubble hedging lies in timing: if you buy put options too early, the continuous rise of the market will keep making the strike price lag behind the market. Bank of America's solution is the "max lookback put" — its strike price keeps moving up as the market rises, but this feature itself comes with a relatively high cost. The bank's innovation lies in setting the option to take effect only when the 10-year SOFR is 25 basis points below the current forward rate, so as to convert the expectation of falling interest rates into option premium subsidies.
The specific trading plan is: buy a daily observation max lookback put option on the Nasdaq 100 Index, which expires in September 2027 with a strike price of 90% of the current price, attached with an interest rate trigger clause. The indicative option premium is 3.62%, which is 46% lower than the pure lookback put option, and 23 basis points lower than the ordinary put option.
Backtest data shows that after simulating and pricing this structure over the past 30 years, its trigger probability is 13% (11% for ordinary 90% put options), the average in-the-money payout multiple is 7.2 times (6.1 times for ordinary put options, 3.9 times for pure lookback options), and the maximum excess return appeared during the dot-com bubble burst.
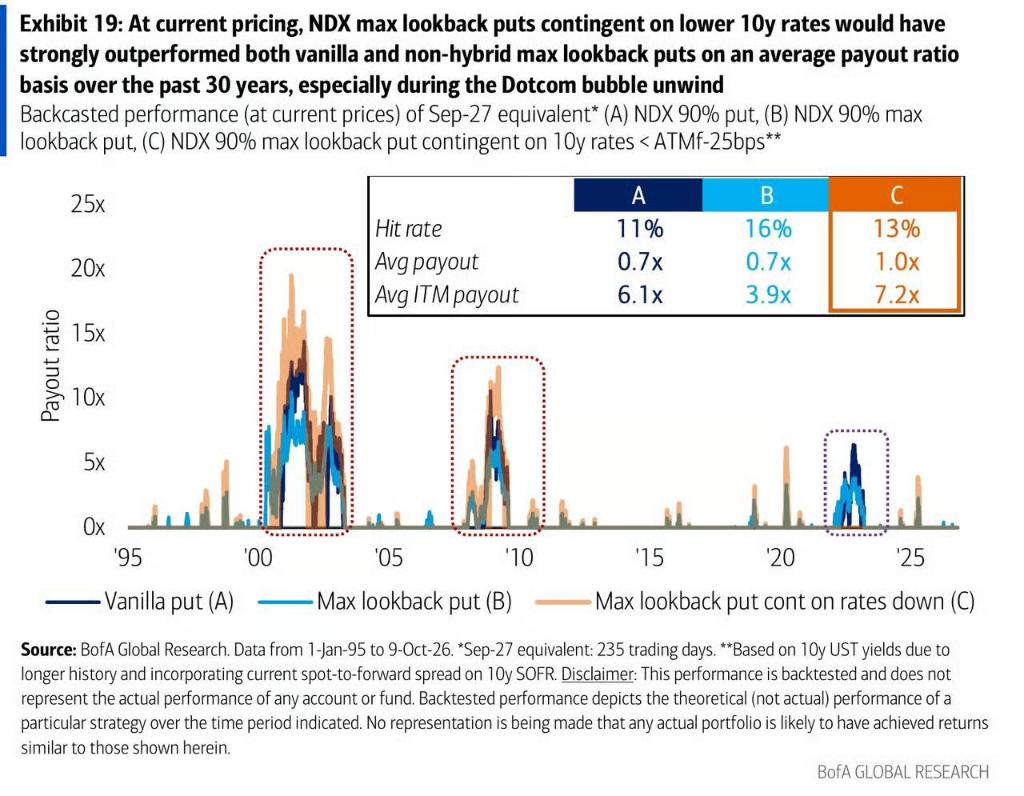
The main risk of this structure lies in the 2022-style "stocks down and bonds up" scenario, that is, the pattern of stocks and bonds falling in the same direction caused by inflation shocks or unexpected Federal Reserve tightening — which is exactly the operating mode of the bond market for most of 2026, not a real tail risk.
In addition, Bank of America simultaneously recommends a VIX call spread trade: buy the VIX November expiry 19-24 point spread, with an indicative cost of $0.63 and a maximum payout multiple of about 7.9 times, which is suitable for the judgment of a moderate rise in volatility around the mid-term elections.
How severe is the bubble: Indicators show it is concentrated in local areas rather than comprehensive
The latest reading of Bank of America's Bubble Risk Indicator (BRI) provides a more detailed perspective. At present, only 13 stocks in the S&P 500 have a BRI exceeding 0.8, accounting for about 2.4% of the total index weight; in contrast, during the peak of the dot-com bubble, 50 to 100 stocks hit this threshold, accounting for 20% to 40% of the index weight.
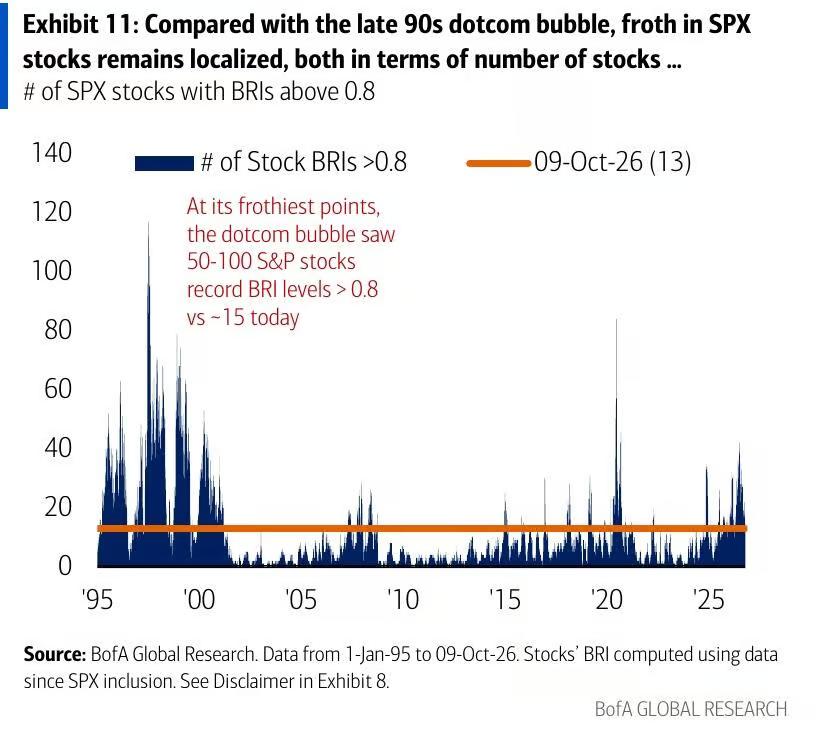
The current bubble characteristics show obvious concentration: at the single-stock level, Moderna (MRNA), CrowdStrike (CRWD), Hewlett Packard Enterprise (HPE), Zebra Technologies, Revvity and Palo Alto Networks (PANW) rank top in readings; at the sector level, the BRI of Bank of America's U.S. cybersecurity theme basket and Brazil election theme basket both reach a high level of 0.92.
It is worth noting that the price-level bubble indicators show that the risk is still local, but Jefferies has defined the current situation as the "2008 moment of AI", and pointed out that the two cash-consuming AI labs together account for half of the $2.3 trillion order backlog. This means that the real bubble risk may not be reflected in the stock price level, but lurks in the balance sheet.
Volatility is artificially suppressed, and a loosening may trigger a sharp rebound
Beneath the seemingly calm surface, undercurrents are surging in the market structure. The 5-day intraday realized volatility of the S&P 500 Index is only 7.6%, which is at the third percentile of the past year. But Bank of America believes that this calm is artificially maintained by the huge gamma exposure in the hands of option market makers.
As of October 9, the hedged gamma reading of the S&P 500 was $14.5 billion, the fourth highest in the past year. A large number of 0DTE/1DTE option selling flows and the structural volatility supply of derivative income funds together form a "guardrail" for the market, keeping intraday fluctuations within a very narrow range.
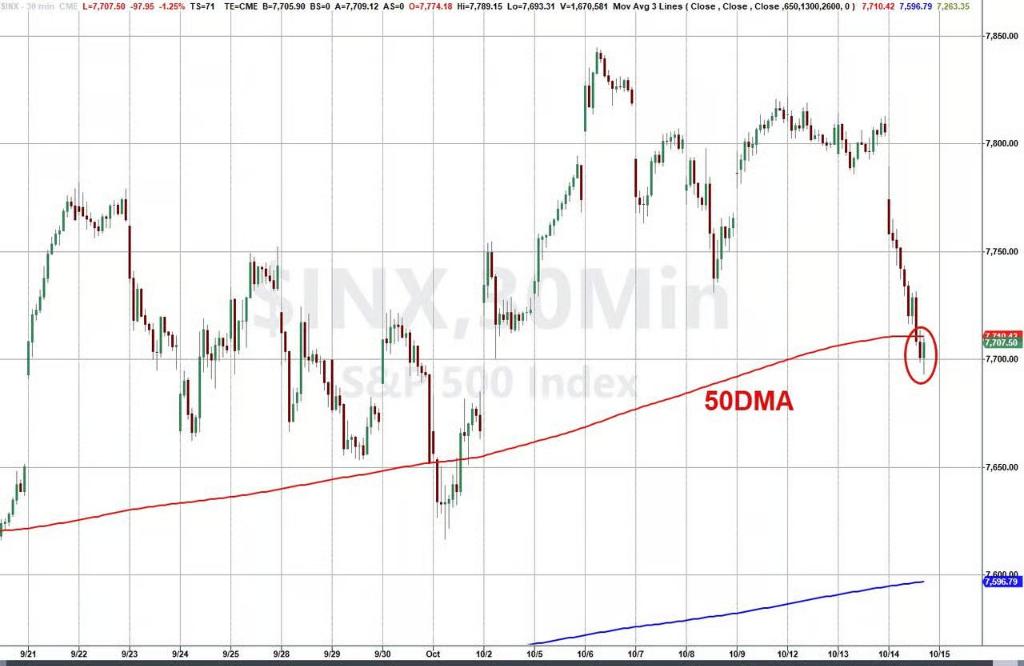
However, this buffer is loosening. According to Michael Ball, macro strategist at Bloomberg, the S&P 500 has fallen below the first support level of 7775 to 7750 points; SpotGamma sets the "volatility trigger point" at 7775 points — below this level, the hedging behavior of market makers will no longer play a role in stabilizing volatility. Once the index falls below around 7700 points, positive gamma will thin sharply, and the mean reversion strategy of buying on dips may give way to the "sell as it falls" mode.
At the same time,