Even small teams can conduct pre-training, Puyu 2B: the training cost on RTX 5090 is less than 5090 USD
Unable to afford training the 2.8T K3, having had enough fun with 124M nanoGPT, and wanting to try pre-training with ten billion parameters and trillion tokens — how high is the barrier to entry?
This type of model is widely used, for example, the classic Qwen series (Qwen2-1.5B, Qwen2.5-1.5B, Qwen3-1.7B...).
However, although the Qwen series has open-sourced its weights, it has not fully disclosed the complete pre-training recipe. While OLMo, SmolLM and other projects have further open-sourced their data and training details, reproduction is still costly: it is estimated that even with only ten billion-level parameters, the computing power cost required to reproduce OLMoE-1B/7B and SmolLM3-3B is approximately $200,000 and $719,000 respectively.
For ordinary laboratories, knowing "how to train" is not enough — they also need to be able to "afford the training". We need a set of low-cost, reproducible "budget-friendly" pre-training solution.
Puro-2B: A Full-Process Open-Source "Budget-Friendly" Pre-Training Solution
Focusing on this problem, the team of Professor Chen Wenguang and Professor Lü Kaifeng from Tsinghua University jointly launched the full-process open-source Puro-2B, which has open-sourced training data, training framework, training configuration and model weights.
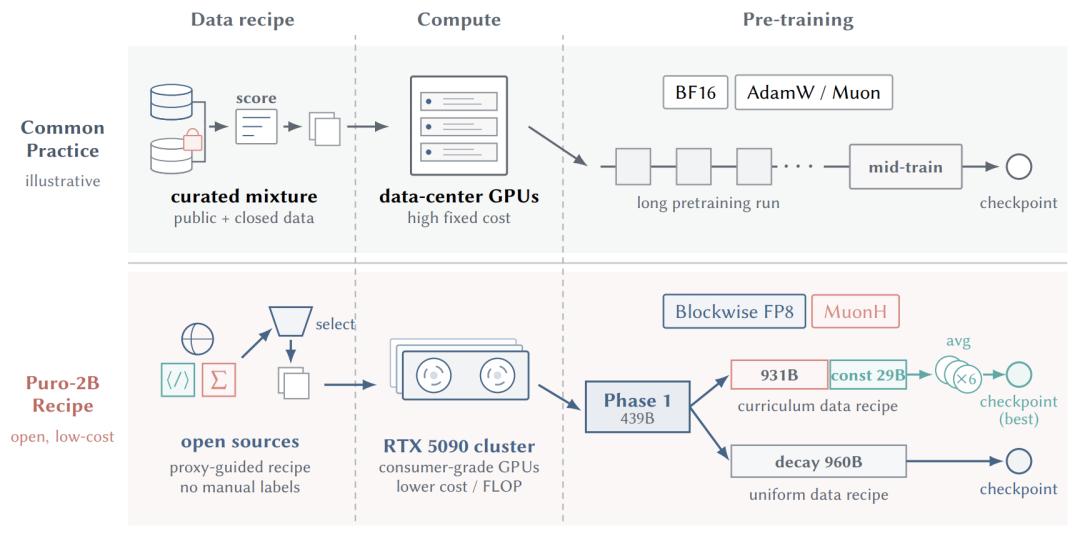
Paper Figure 3 | Puro-2B "Budget-Friendly" Training Pipeline
They trained a model with about 2 billion parameters from scratch on a computing cluster of consumer-grade RTX 5090 graphics cards, using up to 1.4 trillion tokens.
In a comprehensive evaluation covering 15 tasks, based on this solution, with a pre-training computing cost of about $4,400, the model outperforms Qwen2-1.5B in the average metrics of 15 tasks. The best version with a cost of $6,900 has an average performance close to Qwen2.5-1.5B. Compared with other open-source solutions, Puro-2B significantly reduces the training cost.

Paper link: https://arxiv.org/pdf/2608.27370
Open-source materials collection: https://huggingface.co/collections/thu-pacman/puro-2b
Models and intermediate checkpoints: https://huggingface.co/collections/thu-pacman/puro-2b
Training data and ratio: https://huggingface.co/datasets/thu-pacman/Puro-2B
Training code: https://github.com/thu-pacman/Puro-Megatron
Data processing code: https://github.com/thu-pacman/Kaiyuan-Spark
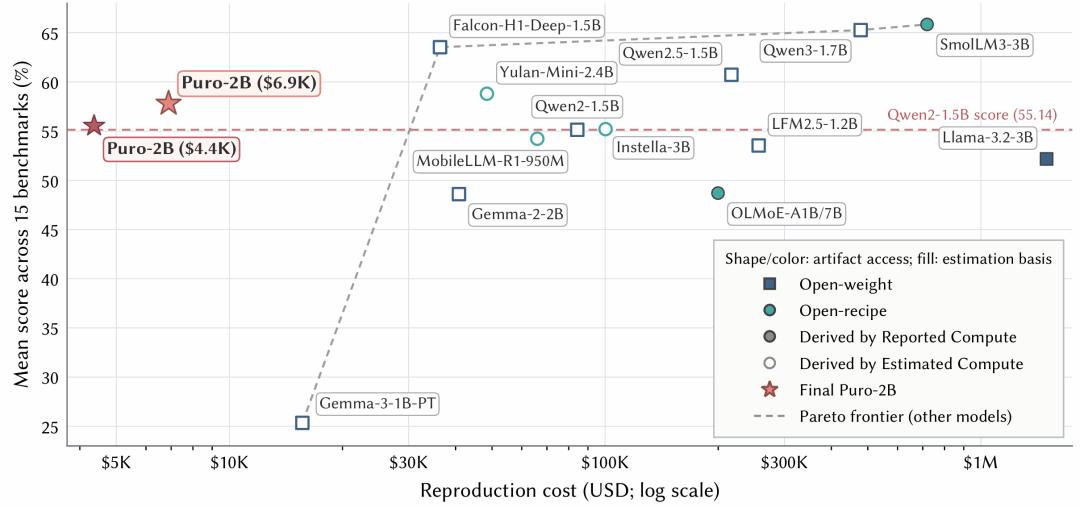
Paper Figure1 | Model Performance and Reproduction Cost
If the budget is even smaller, what level can the trained model reach? They further fitted the cost-performance empirical curve (Puro Cost Scaling Law) to estimate the achievable level of models under different budgets.
They started from the checkpoint of the same first-stage training, adjusted the training budget of the second-stage uniform data recipe, to fit the relationship between the average performance score and the total cost.
This empirical curve for the Puro training solution allows researchers to estimate the capability level that can be achieved with different budget costs before formal training, and adjust the training solution according to requirements, without having to reproduce the longest model training process.
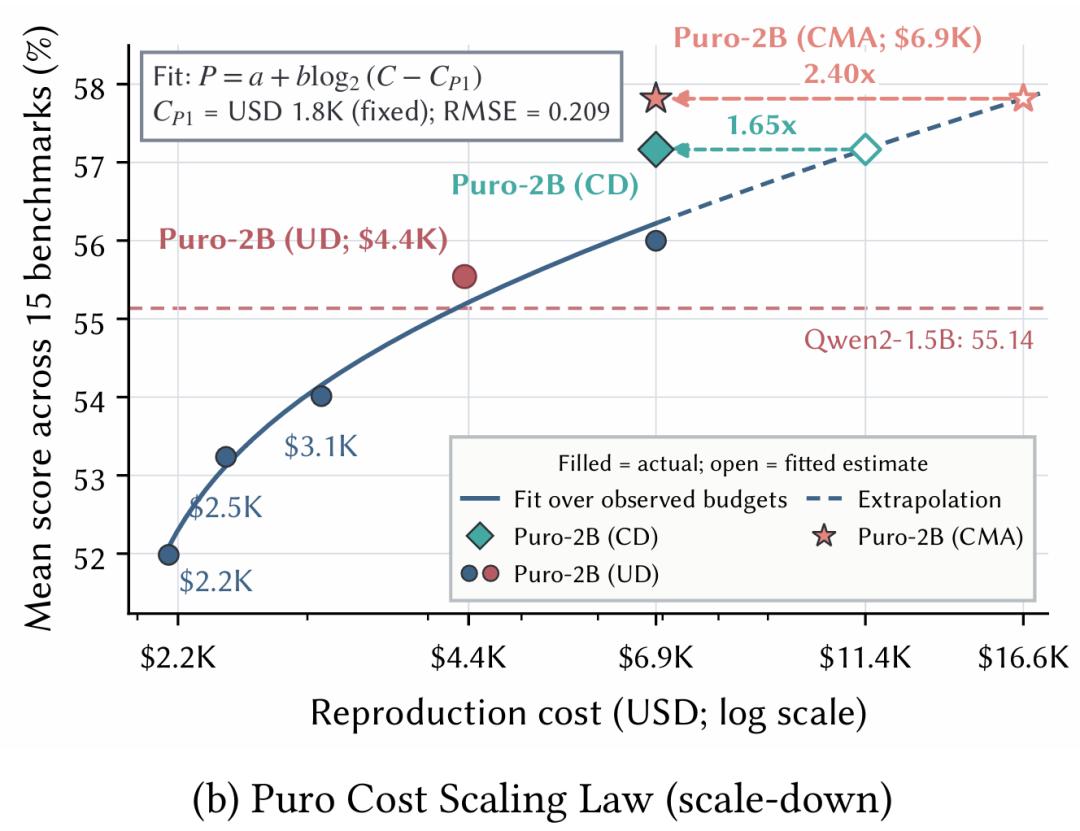
Paper Figure 2b | Puro Cost Scaling Law
This low-cost solution comes from the collaborative design of five parts: hardware selection, low-precision training, optimizer improvement, high-quality data utilization efficiency, and data selection.
Higher Computing Power Per Unit Cost
Compared with other open-source training solutions, the Puro-2B team started from more fundamental, more underlying, and more practical problems:
How much computing power can be bought with the same budget?
Calculated at the GPU rental price adopted in the paper, they found that the peak BF16 computing power per dollar of RTX 5090 is about 2.77 times that of H200. This means that per unit cost, RTX 5090 can obtain more computing power than widely used data center cards, and at the same time, as a consumer-grade graphics card, RTX 5090 also takes into account the accessibility of hardware.
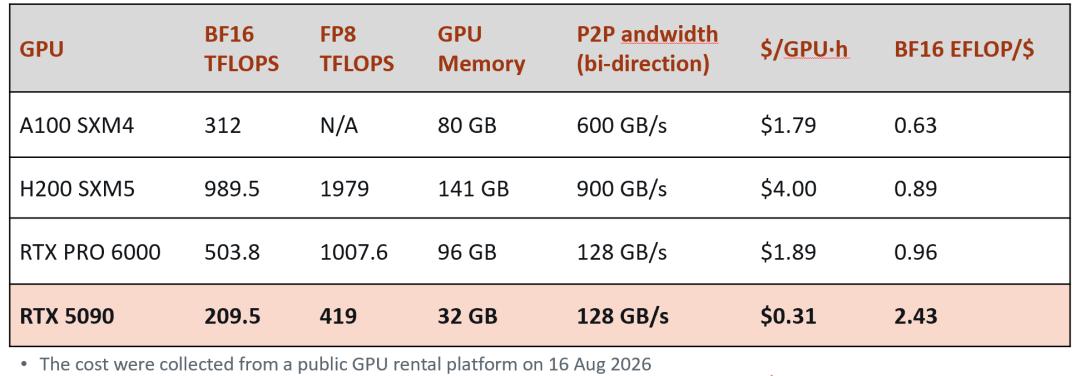
Simplified Paper Table 2 | Statistics and Comparison of Computing Price Ratios of Different Graphics Cards
However, RTX 5090 only has 32GB of video memory and no NVLink, so it cannot directly copy the training configuration of data center GPUs.
The Puro-2B team adjusted through driver and system configuration, enabled PCIe P2P communication within the node, increased the unidirectional bandwidth between GPUs from 31.5 GB/s to 56GB/s, and reduced the communication latency from 14.3µs to 0.4µs;
GPU Direct RDMA is enabled between nodes, which increases the 24-card AllReduce bus bandwidth from 8.87GB/s to 19.93GB/s.
Puro's training strategy is also optimized for the computing load of ten-billion-level parameter scale and the hardware characteristics of RTX 5090: they adopt a combination of data parallelism and pipeline parallelism to avoid tensor parallelism with frequent communication;
By redistributing the computing load of each stage of the pipeline, adjusting the micro-batch size, and placing the optimizer state evenly according to the video memory occupation, the video memory load of different nodes is balanced.
Through the above optimizations, the comprehensive MFU can exceed 70%, and the cost-effectiveness of consumer cards is transformed into the advantage of training cost through these engineering adaptations and system optimizations.
With more cost-effective computing power, the next step is to improve the computational precision efficiency.
FP8 Leverages the Low-Precision Efficiency Advantage of RTX 5090
The Blackwell architecture of RTX 5090 also provides the foundation for FP8 training. They follow the fine-grained block quantization idea of DeepSeek-V3, put the matrix multiplication of the main linear layers on the FP8 path, while keeping numerically sensitive operations and training states at BF16 or FP32 precision.
FP8 will bring a certain precision loss. To judge whether it is cost-effective, they verified the net efficiency gain brought by FP8 training through controlled experiments (Scaling ladder) of different model scales.
Through experimental control of five model scales, they found that compared with BF16, the validation loss of FP8 is about 0.0031—0.0039 higher, but the gap is small and stable across scales.
At the same time, the training throughput efficiency of FP8 is increased by 1.36 times; after converting the precision loss into the additional calculation required to reach the same loss, it is estimated that there is still a net efficiency gain of about 1.34 times.
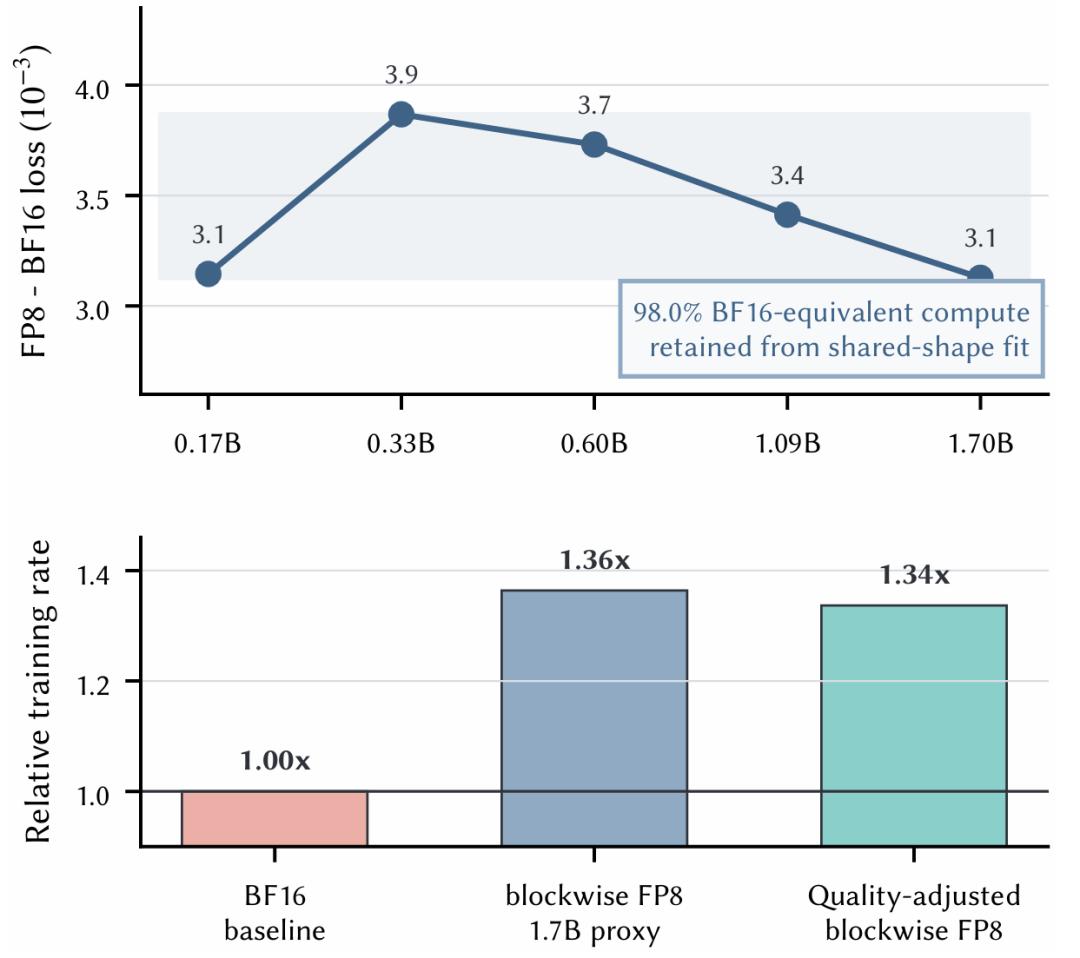
Paper Figure 10b | FP8 Loss Gap and Efficiency After Quality Correction
From Ordinary Learning Rate to Effective Learning Rate
After determining the calculation accuracy, how to design the optimizer and learning rate will affect the effect of each update. The optimizer determines the update direction of each step, and the learning rate determines the update step size of each step.
They adopted the emerging MuonH optimizer: on the basis of Muon, the update amount of the weight is normalized, and after the weight update, the weight is projected back to a fixed radius, so as to control both the update norm and the weight norm at the same time.
In this way, the Effective LR (ELR), which measures the update amount relative to the weight scale, can be explicitly preset, instead of drifting indirectly with the change of the weight scale during the training process.
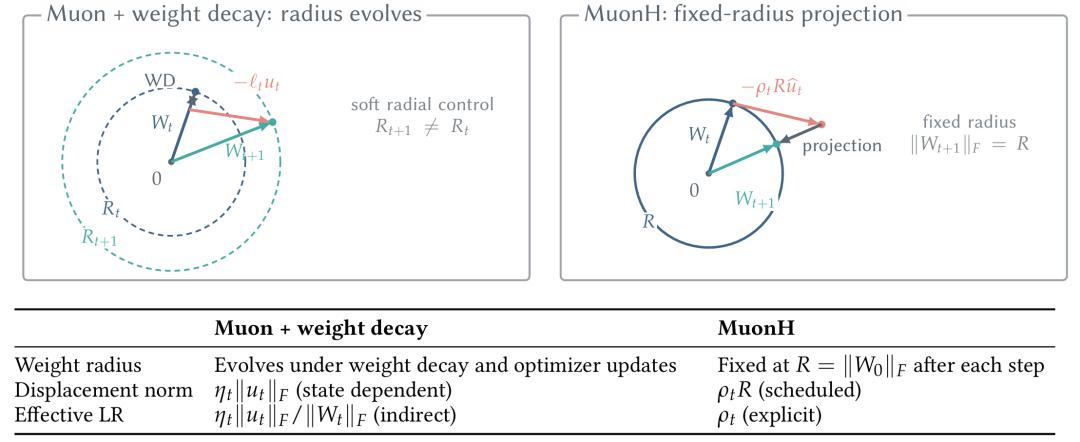
Paper Figure 4 | Schematic Diagram of MuonH Principle and Comparison with Muon
Their key observation comes from a set of controlled experiments: using ordinary Muon without fixed-radius weight projection, only by dynamically adjusting the learning rate to align the ELR trajectory of the training process with MuonH, the loss curve will almost coincide.
This shows that in practice, the advantage of MuonH cannot only be attributed to the norm constraint — the change process of the effective learning rate ELR is an important clue to understand the effectiveness of hyper-sphere optimization.
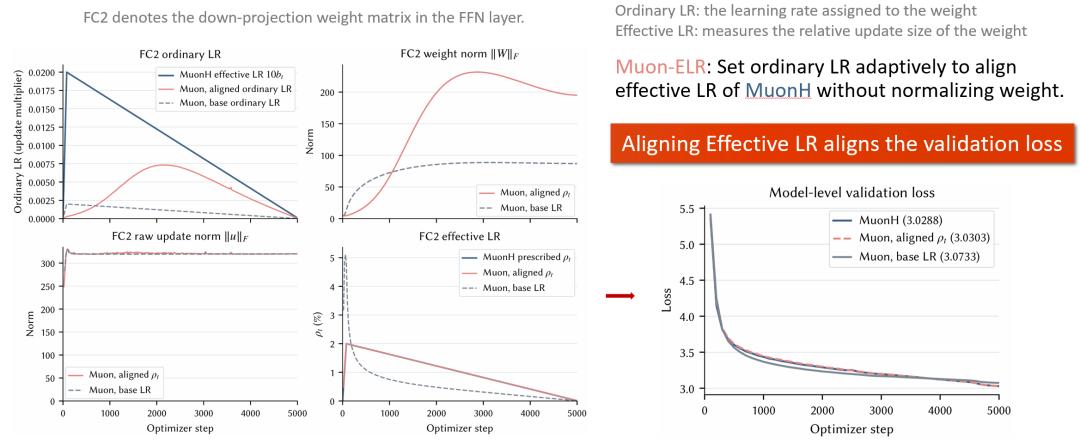
Combined Paper Figure 5 and Figure 15 | Explanation and Comparison of ELR Alignment Experiment
Further comparison shows that when weight decay has insufficient constraints on the weight norm, the ELR of the ordinary Muon optimizer drops faster in the early stage, and the loss also decreases earlier; MuonH retains a more gentle decay and performs better in the later stage.
This made them shift their attention from "which optimizer to use" to "how to design a more reasonable effective learning rate schedule (ELR schedule)".
Subsequently, they performed ablation on the peak learning rate and training data volume for the attenuation phase ratio of training. The results show that higher peak learning rates and longer training cycles usually require longer decay processes.
Therefore, they adopted a power schedule that does not depend on the preset end point in the first stage of training to support continuous training; in the second stage, they adopted long linear decay to leave space for the final loss convergence.
Further comparison based on Scaling Ladder shows that the training efficiency of the MuonH scheme is about 1.19 times that of the tuned Muon baseline.
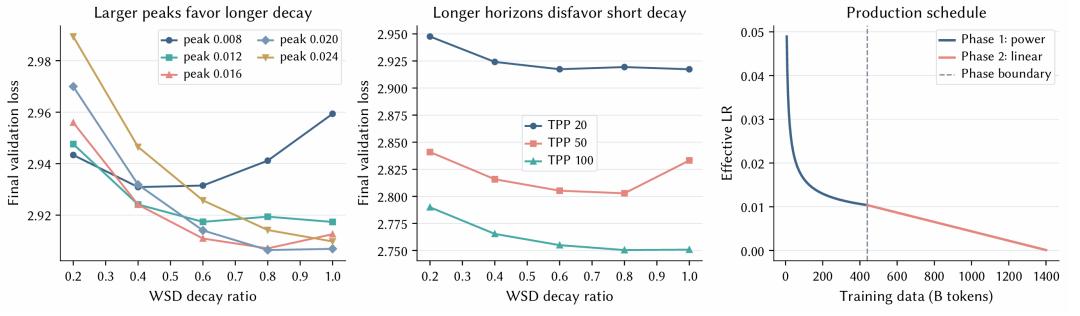
Paper Figure 6 | Learning Rate Design
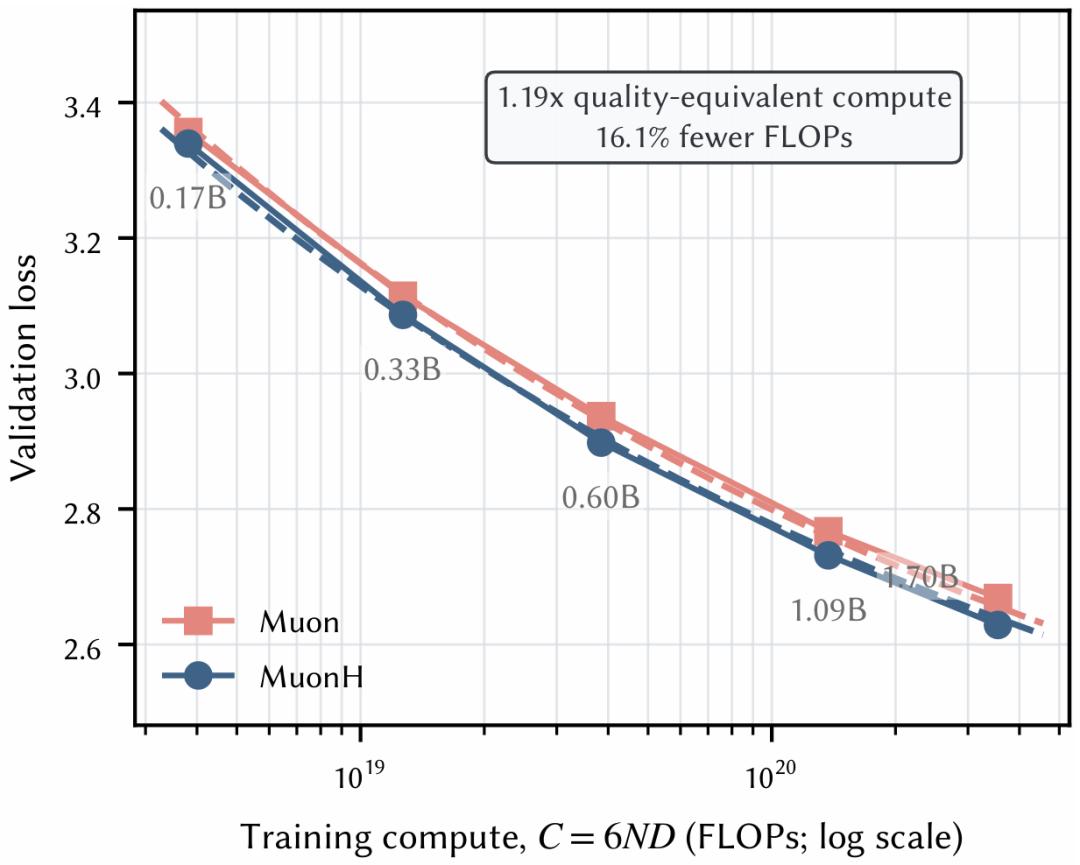
Paper Figure 10a | Training Efficiency Ablation of MuonH
Put High-Quality Data in the Later Training Stage, and Ensure the Model Can Learn Effectively
In addition to the optimizer, data efficiency is also affected by data arrangement. High-quality data does not account for a high proportion in the training dataset but plays a key role. Placing it in the later training stage helps to improve utilization efficiency. Many open-source datasets will provide quality scores for samples at the same time.
The Puro team used these signals to arrange higher-quality samples in each data source to the later training stage, and then aligned and mixed data blocks from different sources according to the training progress.
In this way, the dataset gradually moves to a higher quality range during the training process, while keeping the dataset ratio in the local training range approximately stable, avoiding sudden changes in the proportion of domain data caused by quality changes.
However, arranging the data well does not mean that the model can fully learn it. Previous research by the Puro team found that when the learning rate is too low in the later stage of training, the high-quality data that appears at the end is difficult to drive parameter updates