Chinese leading domestic enterprises: "reaping all the benefits from both sides"
In the article *Jen-Hsun Huang and Yang Xiaokai*, I explain from the perspective of new institutional economics why NVIDIA injects credit into the AI industrial chain.
Data shows that as of July 26, 2026, NVIDIA's accounts receivable stood at 63.1 billion U.S. dollars, accounts payable at 15.1 billion U.S. dollars, with the difference between receivables and payables reaching 48 billion U.S. dollars. In other words, in terms of the account caliber, NVIDIA is a net provider that injects credit into downstream customers.[3]
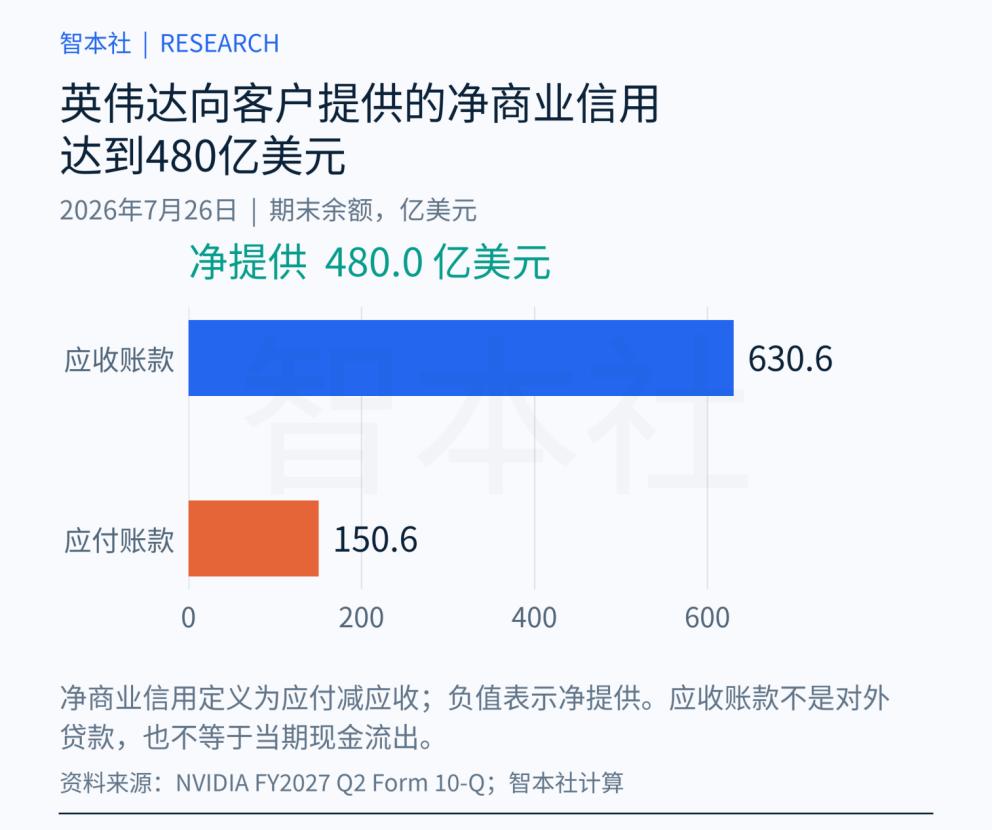
This move stands in sharp contrast to the behavior of large Chinese manufacturing enterprises.
The accounts payable of large Chinese manufacturing enterprises are significantly larger than their accounts receivable, forming a continuous net occupation of commercial credit.
Taking two new energy manufacturers as examples, by the end of June 2026, the net occupation including bills of Manufacturer 1 and Manufacturer 2 reached 214.4 billion yuan and 170.2 billion yuan respectively; the payable turnover days in the first half of the year were 266 days and 142 days respectively.[6]
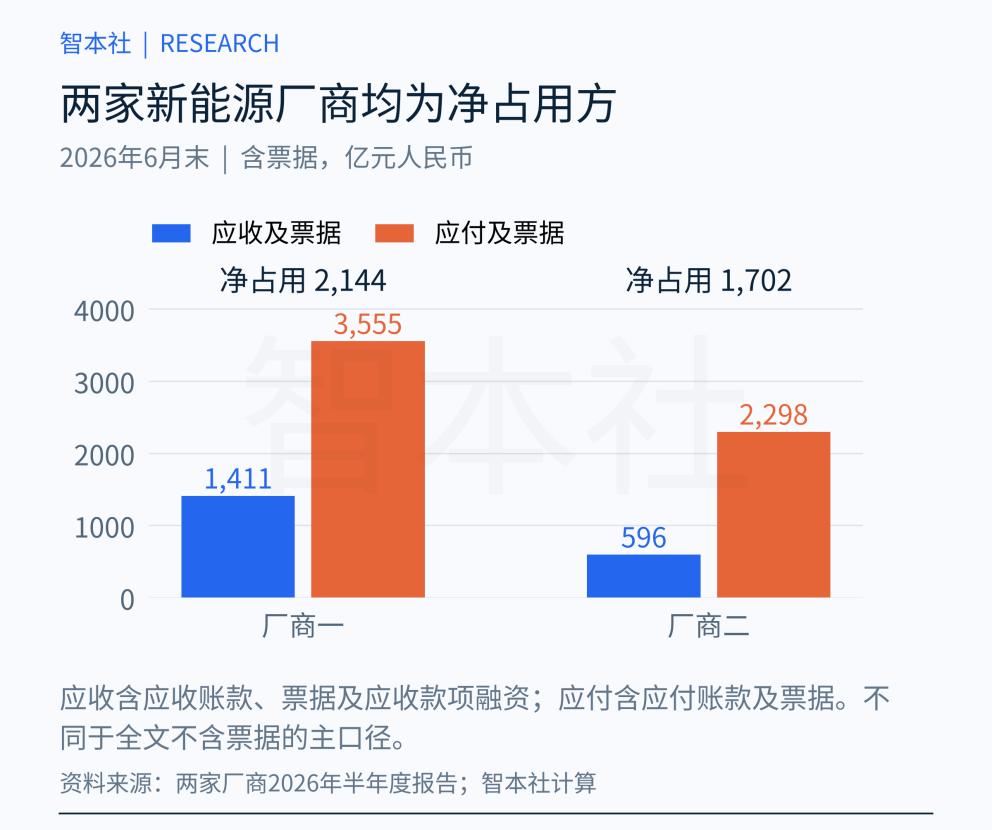
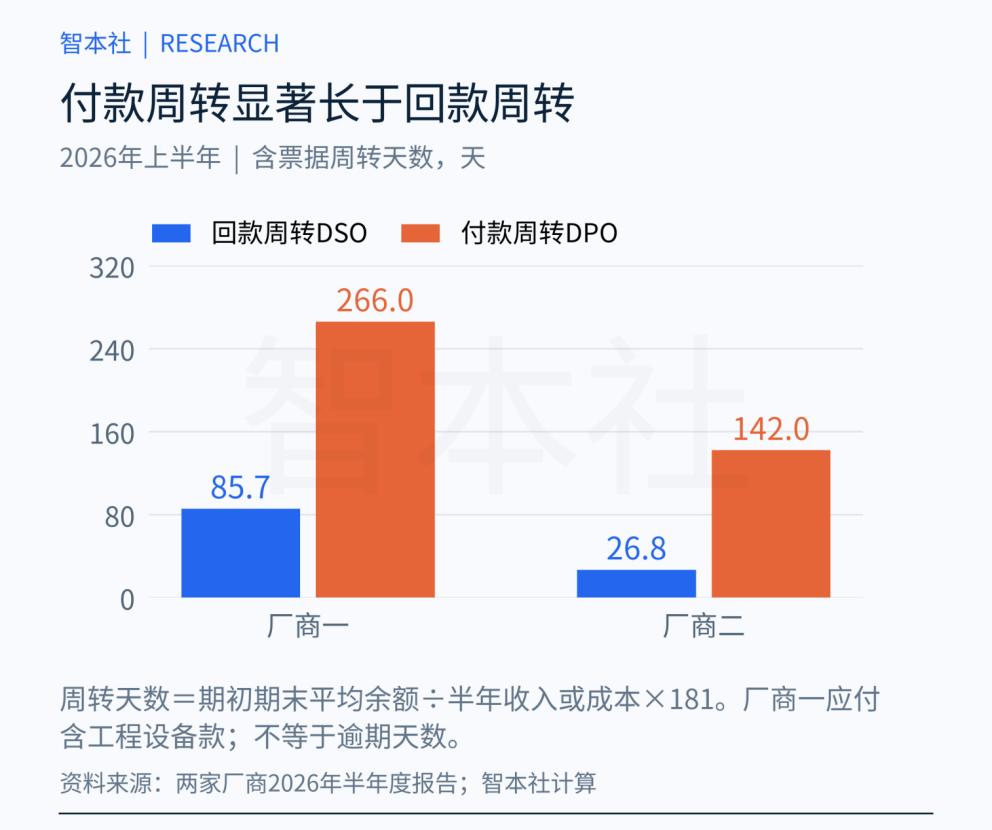
Large U.S. enterprises are net providers that advance funds for a long time, while large Chinese enterprises are net occupiers that borrow funds for a long time?
Is NVIDIA an isolated case among U.S. manufacturers? Is the net occupation of large Chinese enterprises a universal phenomenon? What are the reasons behind it? What risks exist?
This paper compares the commercial credit status of listed companies in China and the United States, and finds a serious problem:
Large Chinese enterprises "occupy both sides" and "take all" state credit and commercial credit. The two types of credit may reinforce each other, easily inducing macro risks such as delayed exit, cost transfer, distorted prices and distribution, and excessive expansion of production capacity and debt.
Logical Framework of This Paper
I. Credit Differentiation
II. Credit Superposition
III. Credit Reversal
Credit Differentiation
Statistics on the samples of listed companies in China and the United States show that this is not an isolated case.
Data shows that in 2025, there were 5,382 available non-financial annual samples on A-share market, with accounts payable of 15.30 trillion yuan, accounts receivable of 9.97 trillion yuan, and a net difference of 5.33 trillion yuan, accounting for 8.4% of operating revenue. There were 1,523 available non-financial annual samples in the United States, with receivables of 1.32 trillion U.S. dollars, payables of 1.18 trillion U.S. dollars, and a net difference of about -0.14 trillion U.S. dollars, accounting for -1.2% of operating revenue.[1][2]
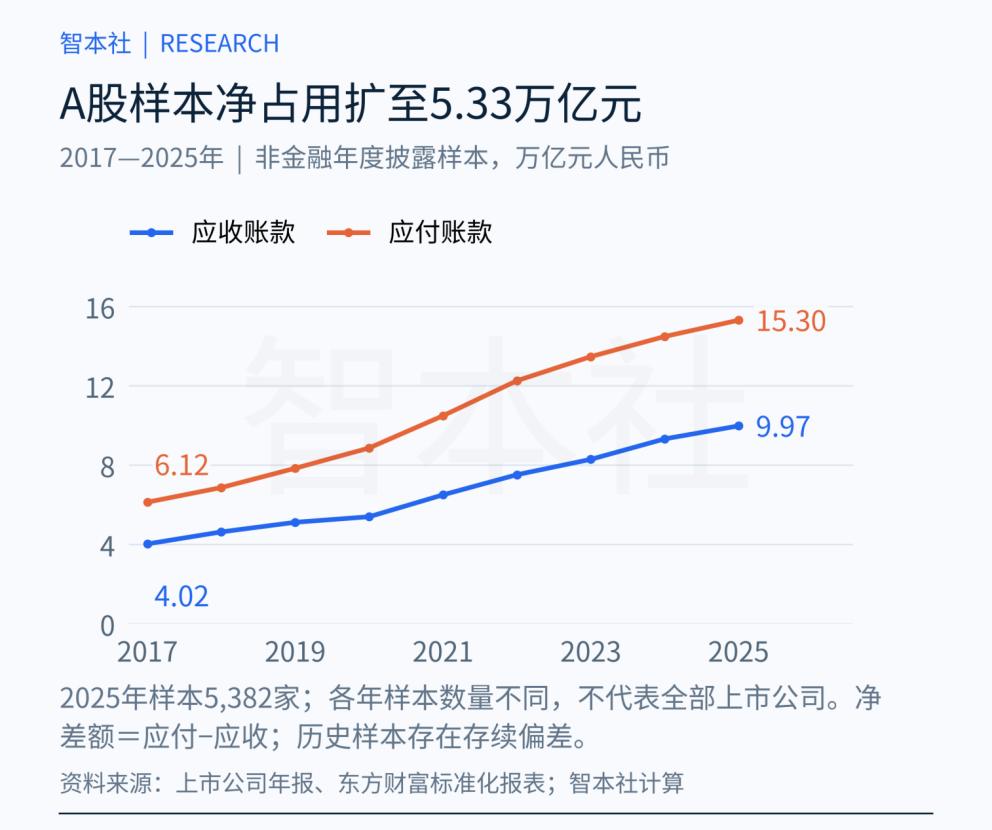
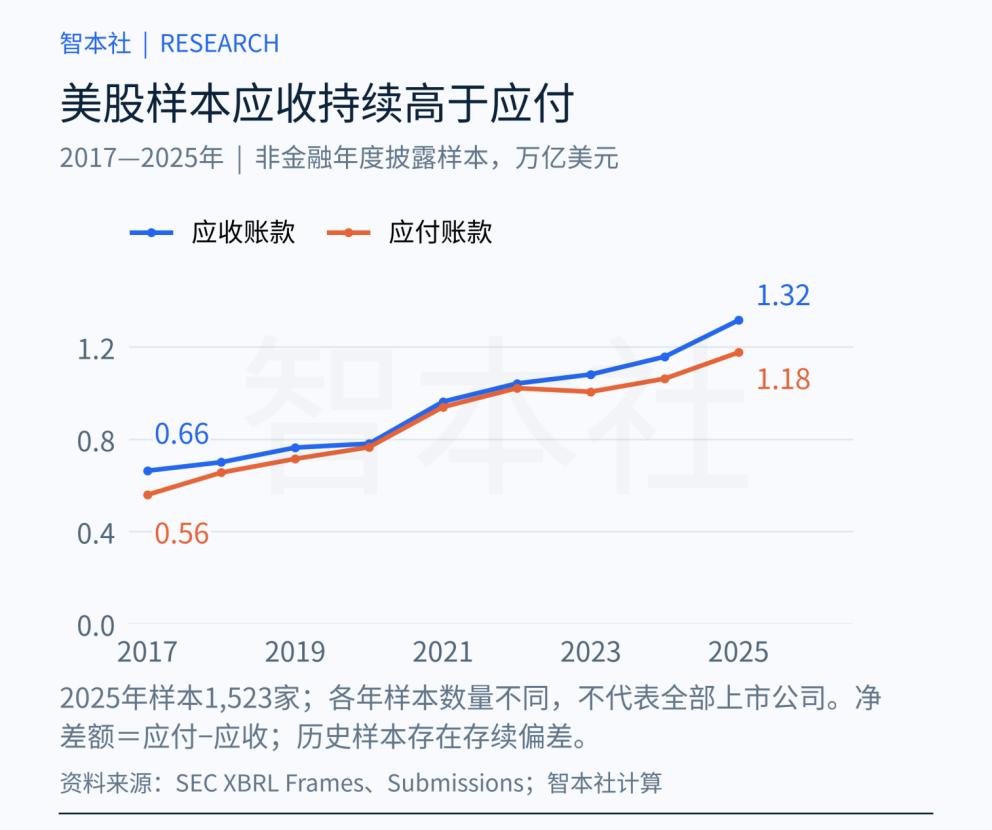
The accounts payable of Chinese samples have long been larger than accounts receivable. The net difference generally expanded from 2017 to 2025, with a particularly obvious increase after 2020. The ratio of net difference to attributable net profit rose from about 129% to about 210%.[1]
The U.S. samples are just the opposite: accounts receivable continue to be higher than accounts payable, and the gap between receivables minus payables has widened since 2022.[2]
What does this mean?
This indicates that under the caliber of commercial credit, the listed companies in the Chinese samples are generally "net occupiers", while the listed companies in the U.S. samples are generally "net providers". What does that mean? The listed companies in the Chinese samples have long borrowed funds from the industrial chain, while the U.S. sample enterprises advance funds for the industrial chain.
NVIDIA is a typical U.S. case.
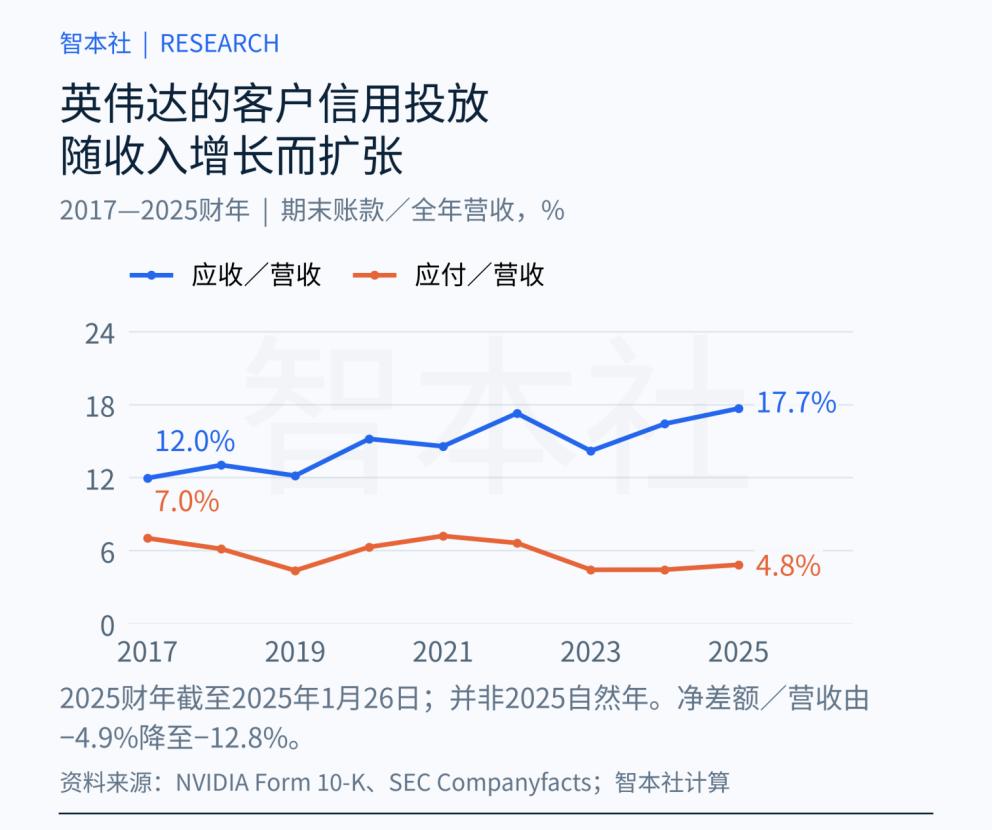
Data shows that in fiscal years 2017 to 2025, NVIDIA's accounts receivable rose from 830 million U.S. dollars to 23.07 billion U.S. dollars, and accounts payable rose from 490 million U.S. dollars to 6.31 billion U.S. dollars. Payables minus receivables has always been negative, and the net difference as a percentage of revenue dropped from -4.9% to -12.8%. In fiscal year 2025, receivables turnover was 46.2 days, and payables turnover was 50.4 days.[5]
In 2026, NVIDIA further expanded its commercial credit support for some customers, playing the role of a credit organizer in the AI industrial chain.
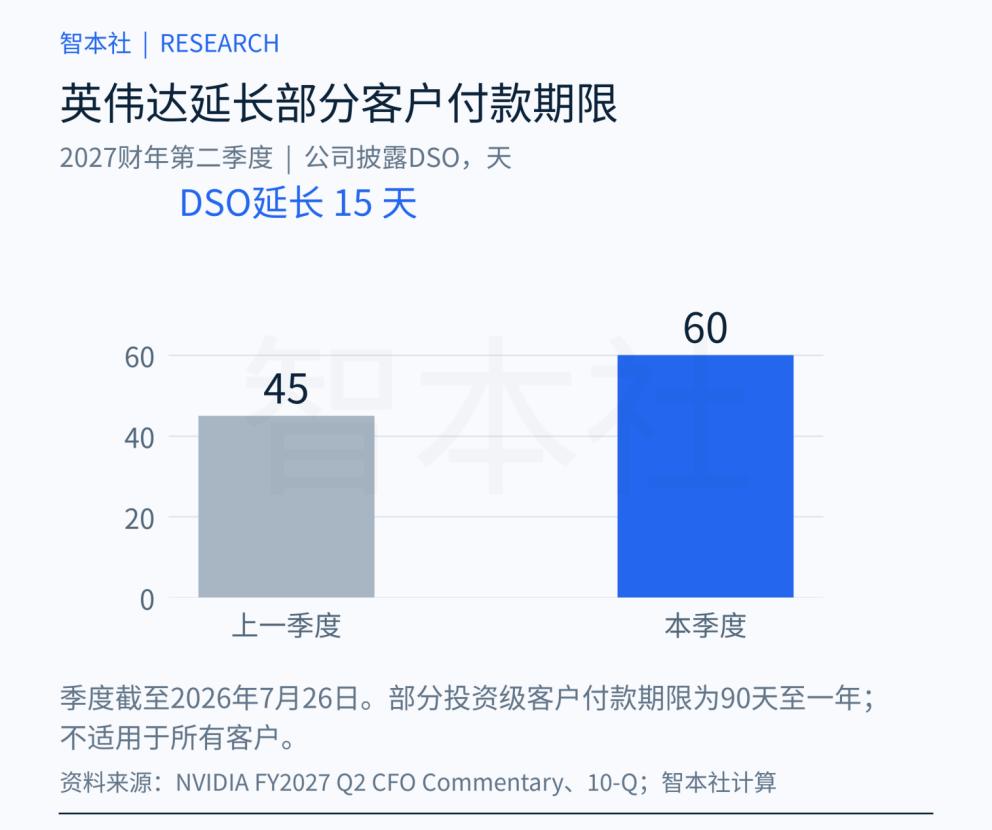
Data shows that as of July 26, 2026, NVIDIA's accounts receivable reached 63.1 billion U.S. dollars, accounts payable reached 15.1 billion U.S. dollars, with a net provision of 48 billion U.S. dollars. The company's disclosed sales collection days rose from 45 days in the previous quarter to 60 days; the payment term for some investment-grade customers ranges from 90 days to one year.[3][4]
Who are the most typical representative enterprises in China? Many large manufacturing enterprises in the sample are typical representatives, whether central SOEs, local SOEs, private enterprises or mixed-ownership enterprises, all finance through the supply chain with large payable balances.
One key data point is the payment term.
Data shows that the payment turnover days of 2,660 fixed non-financial A-share samples rose from 83.9 days in 2017 to 106.7 days in 2025, an increase of 22.8 days; the rise was particularly obvious after 2021. Over the same period, the 533 fixed non-financial samples in the United States rose from 66.1 days to 70.9 days, an increase of 4.8 days. The Sino-U.S. gap widened from 17.9 days to 35.8 days.[1][2]
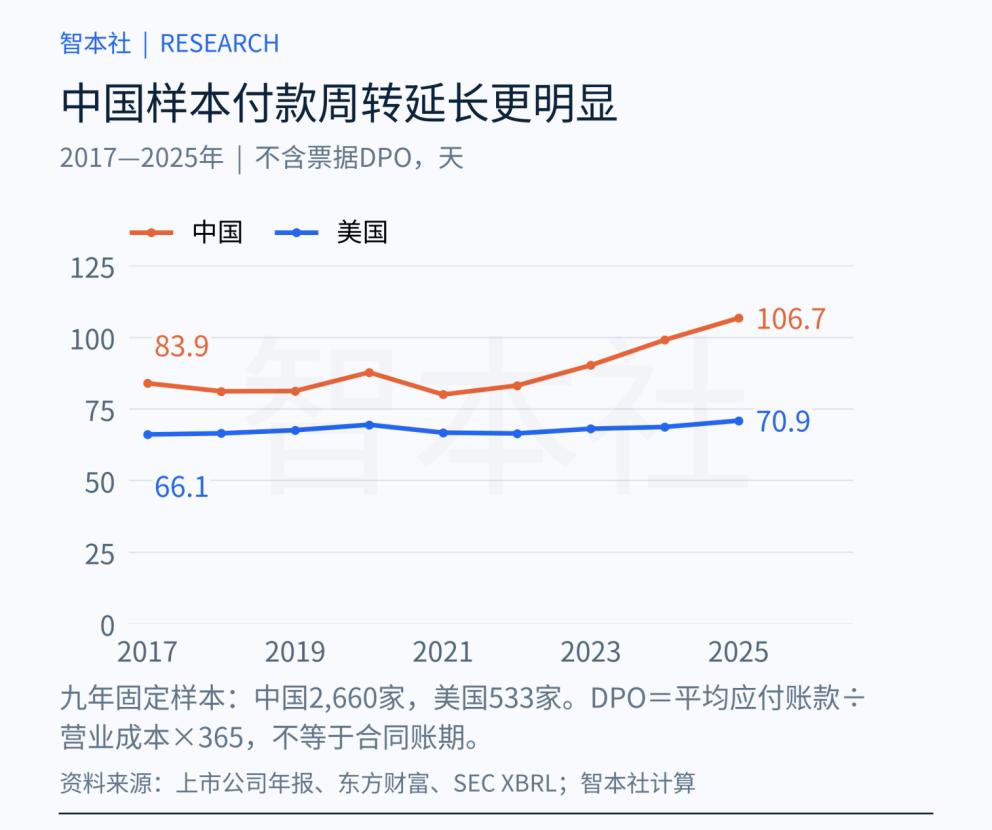
This shows that the listed companies in the Chinese fixed samples generally extend the supplier payment period, continuously conduct large-scale financing to the supply chain, so as to obtain more "chain leader dividends".
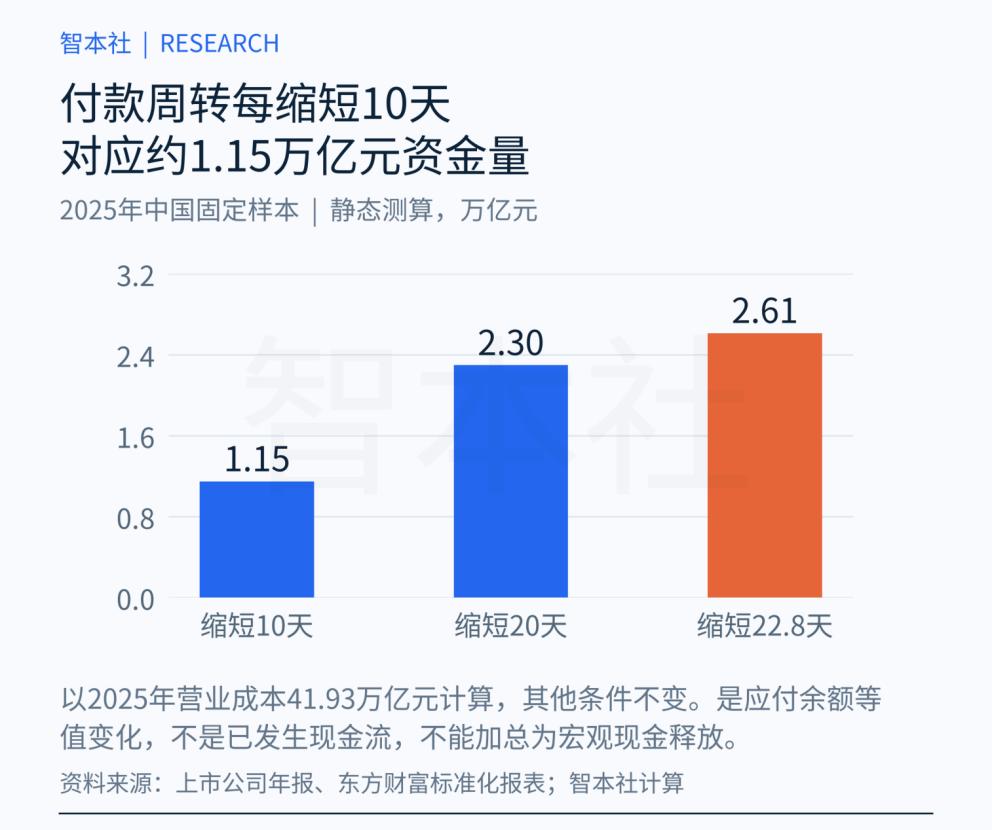
Calculated statically based on the 41.93 trillion yuan operating cost of the A-share fixed samples in 2025, every 10-day shortening of the payment term corresponds to a payable balance of about 1.15 trillion yuan; a 22.8-day shortening corresponds to about 2.61 trillion yuan. In fact, the 22.8-day additional payment period added from 2017 to 2025 means that the fixed sample enterprises occupy 2.61 trillion yuan of settlement period funds.[1]
Therefore, delaying the payment term is the commercial credit dividend of large enterprises, while compressing the payment term is the pressure on their balance sheets.
Some people may say that Chinese listed companies occupy commercial credit because there are many Chinese manufacturing enterprises - the manufacturing industry seems to have the characteristic of commercial credit occupation.
Next, we count the data of industrial sample enterprises in China and the United States:
Data shows that in 2025, there were 1,886 fixed samples of listed industrial enterprises in China, with accounts receivable of 4,084.3 billion yuan, accounts payable of 5,531.4 billion yuan, and a difference of 1,447.1 billion yuan; there were 348 fixed samples in the United States, with accounts receivable of 441.6 billion U.S. dollars, accounts payable of 390.1 billion U.S. dollars, and a difference of -51.6 billion U.S. dollars.[1][2]
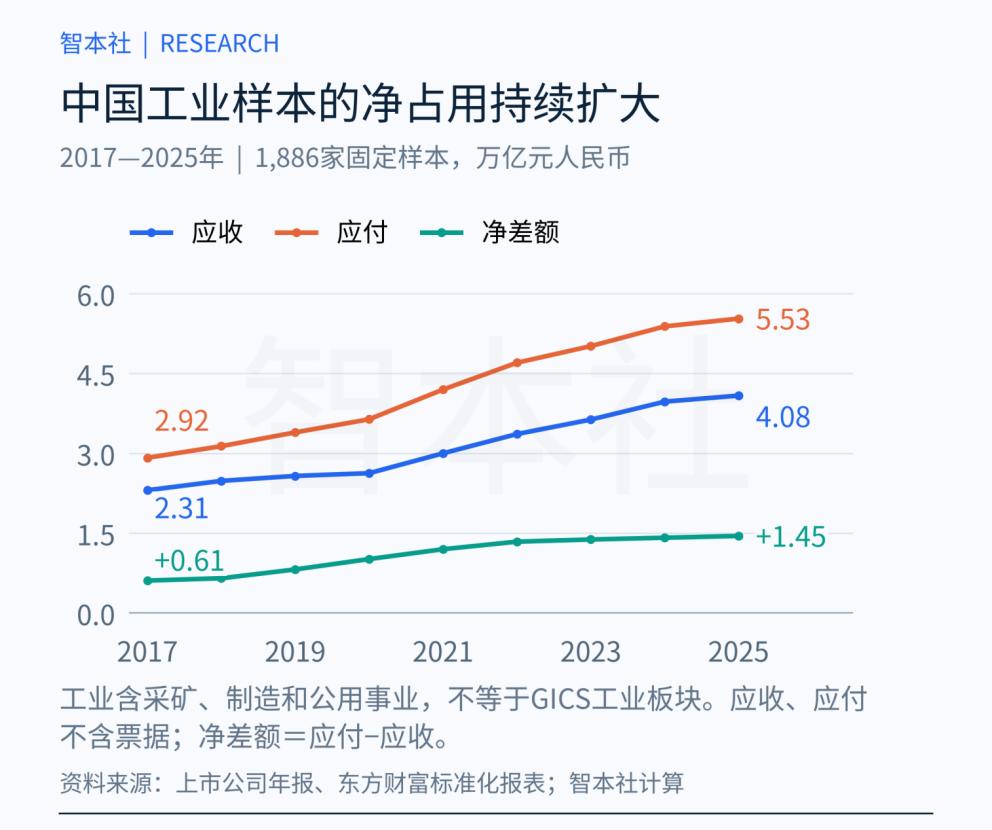
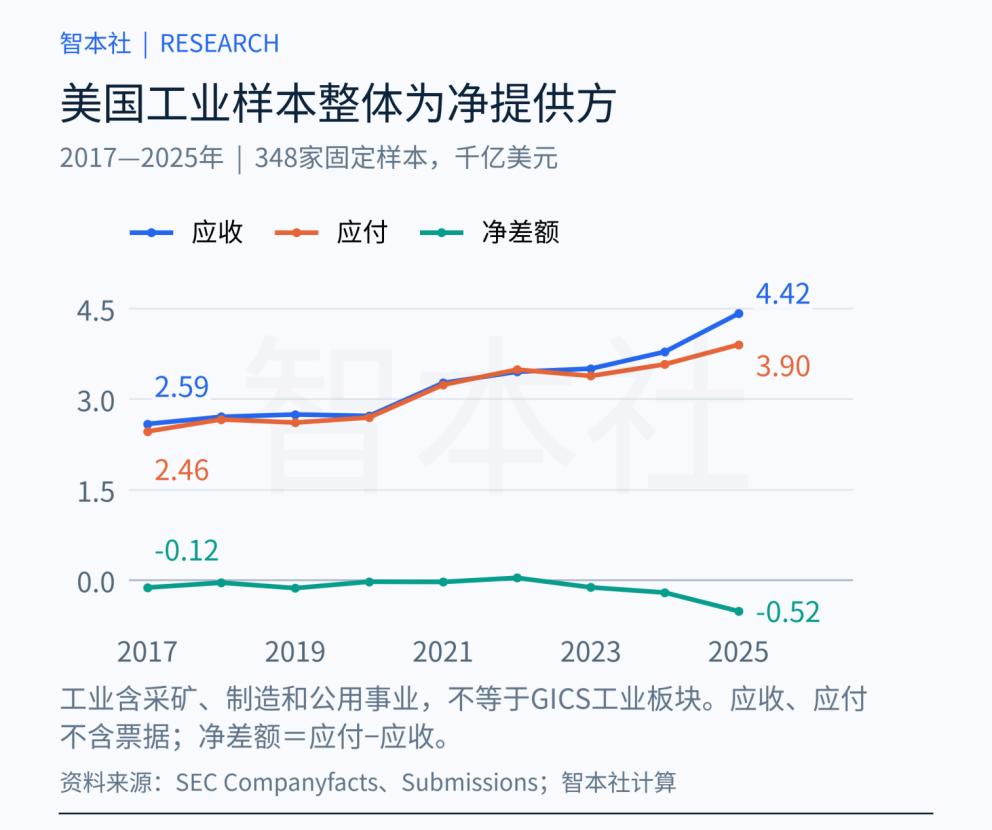
Comparison shows that from 2017 to 2025, the net difference of China's industrial fixed samples as a percentage of operating revenue rose from 3.2% to 4.5%; in the same period, the U.S. figure dropped from -0.6% to -1.5%.
It can be seen that the industrial enterprises in the U.S. samples are also net providers, indicating that the manufacturing industry cannot explain the difference.
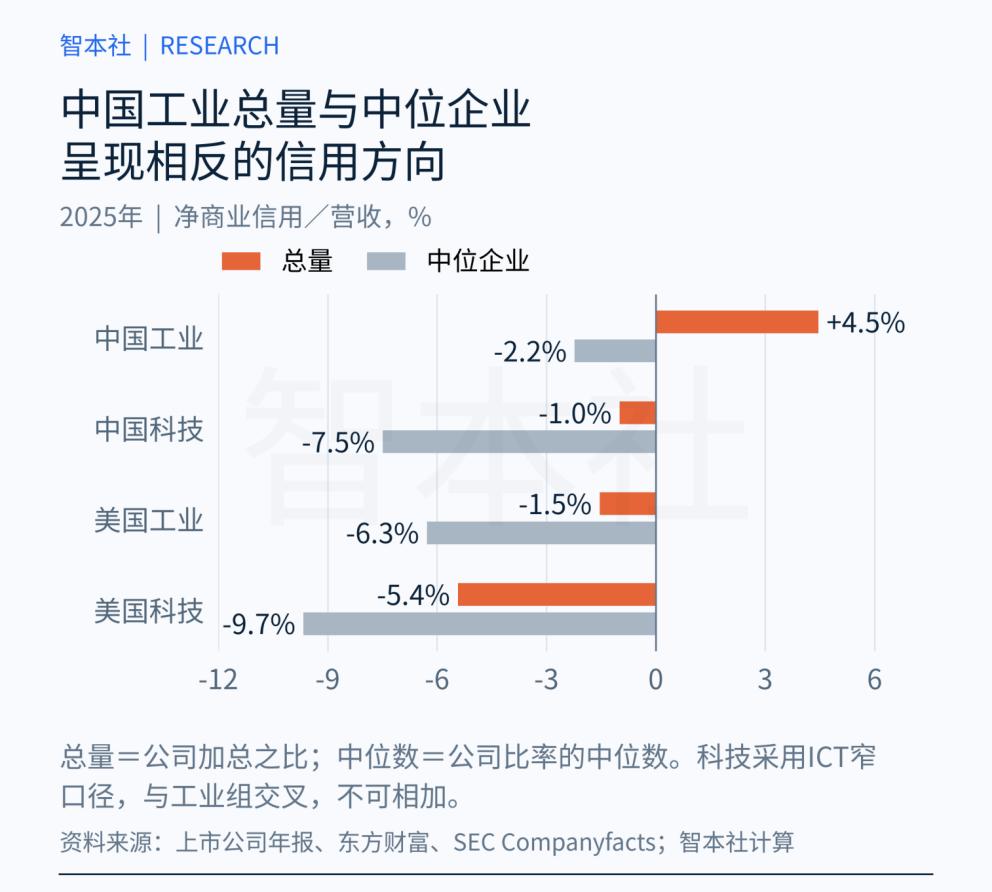
It is worth noting that large Chinese manufacturing enterprises are very strong, and the net occupation is highly concentrated in large enterprises, while the median industrial enterprise is a net provider: in 2025, the median of the company's net difference as a percentage of operating revenue was -2.2%, and the proportion of net occupying enterprises was only 43.2%.[1]
Looking at the leading manufacturing enterprises:
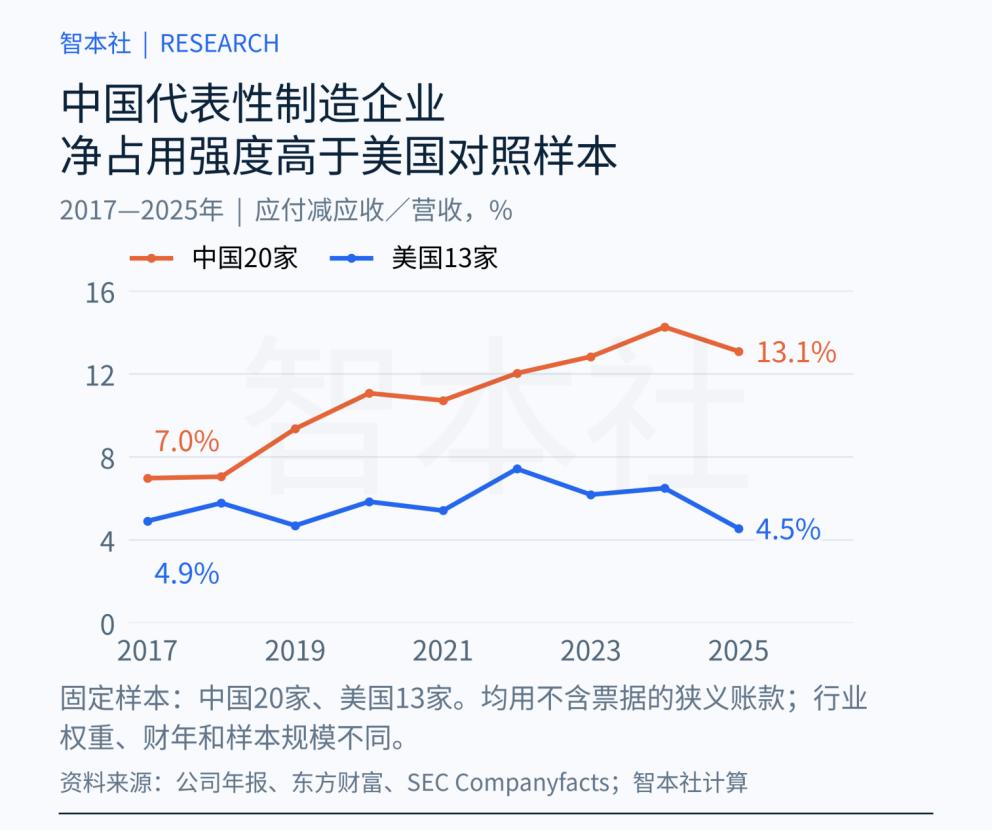
Data shows that from 2017 to 2025, the accounts receivable of 20 fixed manufacturing samples in China rose from 316.7 billion yuan to 581.0 billion yuan, and accounts payable rose from 516.3 billion yuan to 1,235.1 billion yuan. The net difference rose from 199.7 billion yuan to 654.1 billion yuan, accounting for 7.0% to 13.1% of operating revenue, equivalent to the proportion of attributable net profit rising from 124.9% to 266.3%. The net occupation/revenue of 13 U.S. control samples was 4.5% in 2025, and China's figure was about 2.9 times that of the United States.[1][2][7]
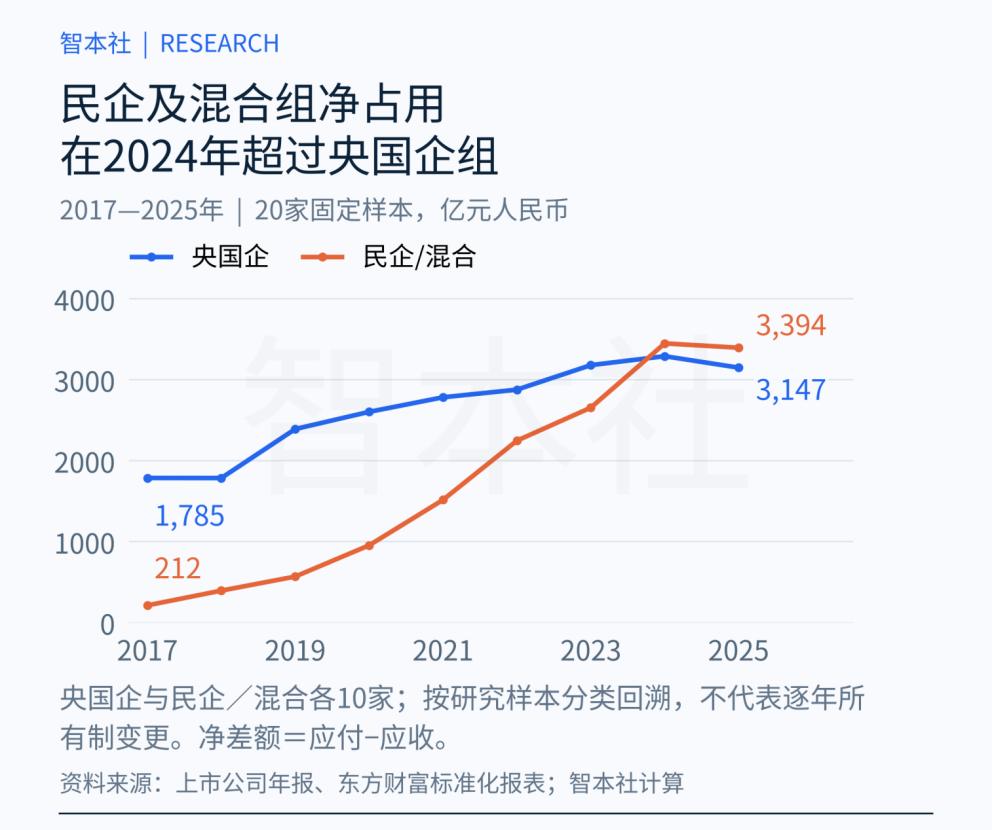
A significant change is that after 2020, the scale of net account occupation of the private/mixed group increased significantly, and surpassed the central SOE group in 2024. In 2025, the net difference of the private/mixed group was 339.4 billion yuan, and that of the central SOE group was 314.7 billion yuan.[7]
Large enterprises directly profit from the net occupation of