From being sidelined to witnessing a global construction frenzy: Why has nuclear power returned to the spotlight?
Over the past two years, the A-share nuclear power index has surged by more than 100% cumulatively, outperforming power sub-sectors such as hydropower, thermal power and new energy by a large margin.
This is the capital market's re-pricing of nuclear power entering a new round of cycle. At present, the more critical question is: how long can the high prosperity of the nuclear power industry last?
Global Nuclear Power Construction Boom
The development of global nuclear power construction has gone through many twists and turns.
Looking back at history, from the 1970s to the 1980s, the average annual installed capacity of global nuclear power reached 17GW. In the following more than 30 years, the installed capacity shrank sharply to an average of 5GW per year. The reasons are as follows: first, in most countries except China, the power generation cost of nuclear power operation has been rising year by year, even exceeding that of gas-fired power generation.
Second, after two nuclear safety incidents in 1986 and 2011, the development pace of global nuclear power slowed down significantly, and many countries became more prudent in the construction of new projects.
However, starting from 2024, global nuclear power has shifted again and entered a new round of accelerated expansion. According to the prediction of Huatai Securities, the average annual new installed capacity of global nuclear power from 2024 to 2035 will rise back to 18GW, returning to the peak level of the 1970s.
The International Energy Agency is more optimistic in its latest World Energy Outlook: under the stated policy scenario, global nuclear power installed capacity will increase from 420 GW in 2024 to 728 GW in 2050. At present, the global nuclear power capacity under construction exceeds 70 GW, the highest level in nearly 30 years.
This nuclear power renaissance is not a lone effort of a single country, but a synchronized race among economies including China, the United States and Europe.
In China, the total investment in nuclear power construction during the 15th Five-Year Plan period is expected to approach 1 trillion yuan, with an annual investment scale of about 180 billion yuan, exceeding the investment amount of any previous year.
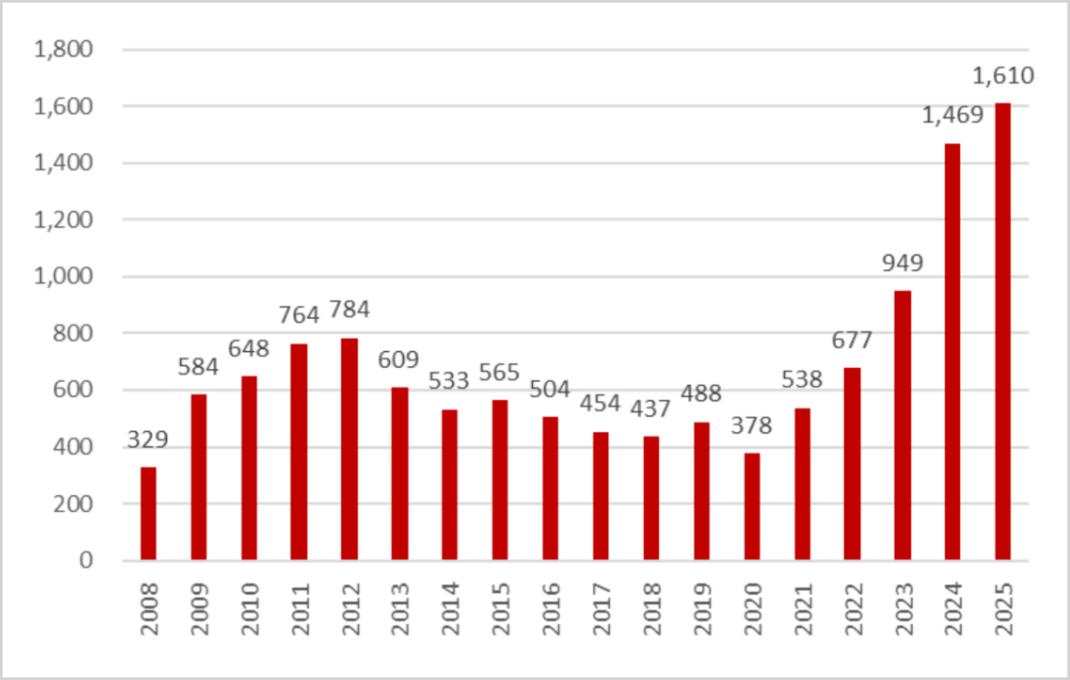
▲ Completed investment in China's nuclear power construction over the years, Source: Wind
According to the plans of the National Development and Reform Commission and the National Energy Administration, the installed nuclear power capacity will reach about 110 million kilowatts by 2030, with a cumulative increase of over 75% compared with the end of 2025, equivalent to 8 to 10 Hualong One units put into operation every year. Between 2011 and 2018, China only approved 11 units in total.
On July 31, the State Council executive meeting approved four new projects including the first phase of Zhuanghe Nuclear Power Project in Liaoning, with 8 new units and a total investment of over 170 billion yuan, continuing the normalized approval rhythm.
In the United States, the expansion plan is more aggressive. In May 2025, Trump announced to raise the 2050 nuclear power capacity target from 100GW to 400GW, and add 35 million kilowatts of new nuclear power capacity by 2035. The executive order requires the U.S. Nuclear Regulatory Commission to make licensing decisions on new reactor construction within a maximum of 18 months, removing obstacles for accelerating nuclear power development from the regulatory level.
In addition, tech giants such as Amazon and Google have intensively laid out small modular reactors (SMR), and enterprises including Microsoft have signed long-term power purchase agreements with nuclear power operators. The rigid power demand of AI computing power has become one of the strongest catalysts for the U.S. nuclear power renaissance.
In Europe, France has abandoned its nuclear reduction target, plans to start construction of 6 EPR-2 units from 2026, and study the feasibility of adding 8 more units. The United Kingdom has set a target of 24GW of nuclear power installed capacity by 2050. The new German government has completely abandoned its anti-nuclear stance, Belgium has overturned its nuclear power decommissioning plan, and Sweden has abandoned its plan to phase out nuclear energy. The attitude towards nuclear energy across Europe has collectively reversed.
In addition, countries including India, South Korea and the Middle East are also actively embracing nuclear power, with plans for new nuclear power projects.
It is undeniable that a new round of global nuclear power construction race has begun.
Uranium Supply Faces the Tightest Shortage
The most direct bottleneck in the nuclear power construction boom does not lie in nuclear power equipment, but in the upstream uranium ore at the very front of the industrial chain.
There is a rare time mismatch between uranium mines and nuclear power plants. The development of uranium mines takes 10 to 15 years, while the construction of a new nuclear power plant only takes 5 to 10 years. The mining life of uranium mines is generally 10 to 30 years, while the service life of nuclear power plants is as long as 40 to 80 years. This natural feature of "uranium mines develop slower and have shorter service life than nuclear power plants" makes the supply-demand balance of natural uranium far more fragile than that of nuclear power installed capacity.
What is more tricky is that the price of natural uranium has been in a long-term slump in the past decade, leading to a sharp drop in global capital expenditure on uranium mines. It is worth noting that after the Fukushima nuclear accident in 2011, the uranium price plummeted from above $65 per pound to a low of less than $20 per pound in 2016.
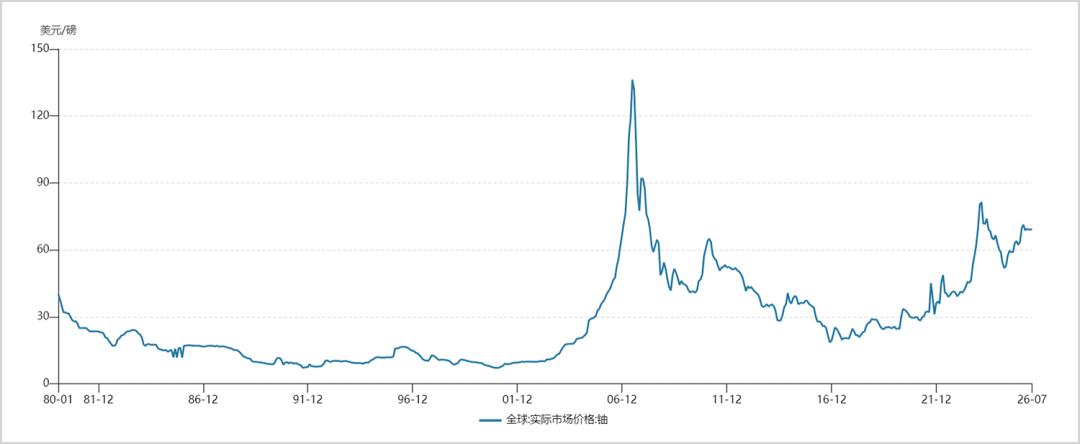
▲ Global uranium price trend, Source: Wind
Hovering at the bottom for a long time, uranium mine developers have severely insufficient investment motivation, and the exploration and construction of new projects have almost stagnated. This means that even if investment is increased immediately, the release of new production capacity will not be realized until around 2035. The nuclear power units approved in batches in the same period will be put into operation one after another in the next five years. This kind of time mismatch is relatively rare in other commodity cycles.
The fragility of the supply side is fully exposed in inventory data. According to UxC statistics, 589 million pounds of U3O8 were signed under long-term contracts worldwide in the past five years, while reactors consumed 815 million pounds, and the gap was filled by consuming commercial inventories.
With this round of global nuclear power construction boom, the demand prospect of natural uranium continues to improve. Nuclear power owners in the United States, India and other countries have accelerated the procurement of natural uranium under long-term contracts since the second half of 2025, pushing uranium from the inventory destocking cycle to the restocking cycle.
Ten years of supply-demand mismatch has led to the bottoming of the inventory cycle, the demand for nuclear power recovery is steadily increasing, and insufficient capital expenditure restricts future supply. The third bull market of uranium prices may continue for a long time. Bank of America raised its 2027 uranium price target to $130 per pound, with the core logic being tight supply and the continuous decline in the long-term contract coverage ratio of power enterprises.
This means that in the global nuclear power race, whoever controls uranium mines will hold the most certain bargaining chip in this cycle.
Major Beneficiaries in the Industrial Chain
China's trillion-yuan nuclear power investment has been launched, and the upstream, midstream and downstream industrial chains have different benefit logics.
The upstream uranium resource segment is a highly certain link in the entire industrial chain. The main players include China Uranium Corporation and CGN Mining, but the two have significantly different business models.
As the national team under China National Nuclear Corporation that guarantees the supply of natural uranium, China Uranium Corporation has a natural uranium business proportion as high as 90%, adopting a heavy-asset, full-industry-chain model.
In China, China Uranium Corporation holds the exclusive right of natural uranium mining (with high operational barriers), owns 19 mining rights in China, and controls the Rössing Uranium Mine in Namibia (the sixth largest uranium mine in the world). The heavy-asset model requires large investment, but it ensures independent and controllable resources, and its profitability is at a relatively high level among uranium mining enterprises.
CGN Mining adopts a light-asset, trade and equity investment model. It does not operate mines itself, but obtains off-take rights by participating in 4 uranium mines under Kazatomprom in Kazakhstan. The light-asset model means relatively low profitability, with gross margin and net profit margin generally lower than those of China Uranium Corporation.
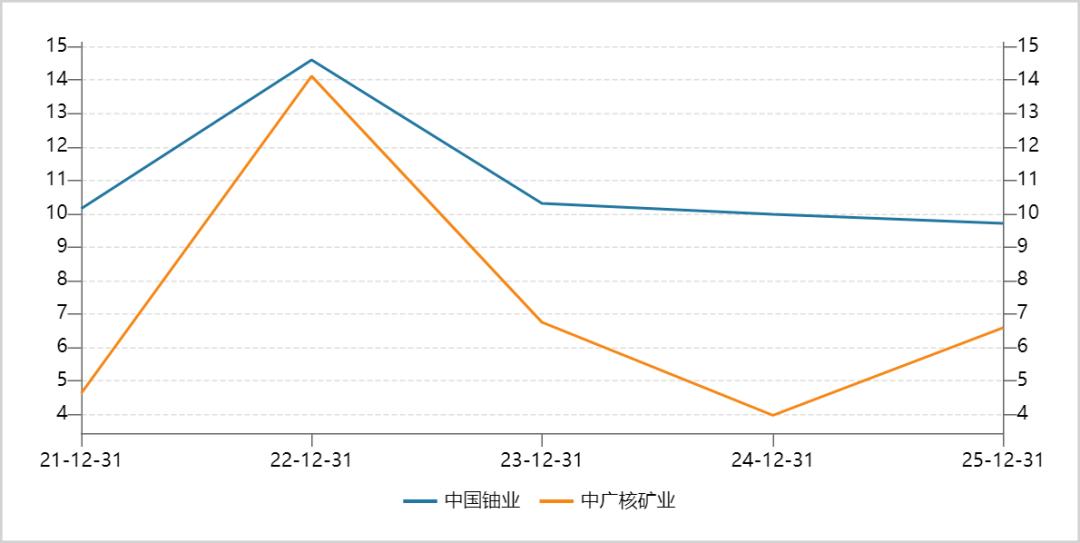
▲ Net profit margin trend of China Uranium Corporation vs CGN Mining, Source: Wind
The midstream nuclear power equipment segment is a highly flexible link. Given the annual market size of 180 billion yuan during the 15th Five-Year Plan period, nuclear power equipment accounts for half of the total, with a market size of up to 90 billion yuan.
Among nuclear power equipment, nuclear island equipment, conventional island equipment and auxiliary system equipment account for 58%, 22% and 20% respectively. Nuclear reactors (pressure vessels, reactor internals), main pipelines and heat exchangers, and steam generators are the three main pieces of nuclear island equipment, with extremely high qualification thresholds, and the market is in a monopolistic pattern.
The main players in this sub-sector include China First Heavy Industries, Shanghai Electric and Dongfang Electric, with the latter two operating more steadily.
In addition, due to full market competition, the gross margin of conventional island equipment and auxiliary system equipment is lower. However, the delivery of nuclear power equipment will enter the peak period in the third year after project approval, and the revenue of relevant equipment manufacturers will enter an upward period starting from 2025.
Looking at the downstream operation segment, it is a cash flow cow type of asset. China National Nuclear Power and China General Nuclear Power are the two major domestic nuclear power operators, occupying more than 90% of the domestic market share and holding scarce operation licenses.
Over the years, the nuclear power tariff has undergone many reforms. Before 2013, the on-grid tariff was determined according to the principle of cost plus reasonable profit. Later, along with the reform of the national power market, nuclear power entered a dual mode of approved tariff and market-based tariff.
Against the background of intensifying marketization, the long-term contract power tariffs in Jiangsu and Guangdong have continued to decline. In 2026, the long-term contract power tariffs in Jiangsu and Guangdong will be 0.3442 yuan/kWh and 0.3721 yuan/kWh respectively, with a cumulative drop of 26% and 33% compared with 2023.
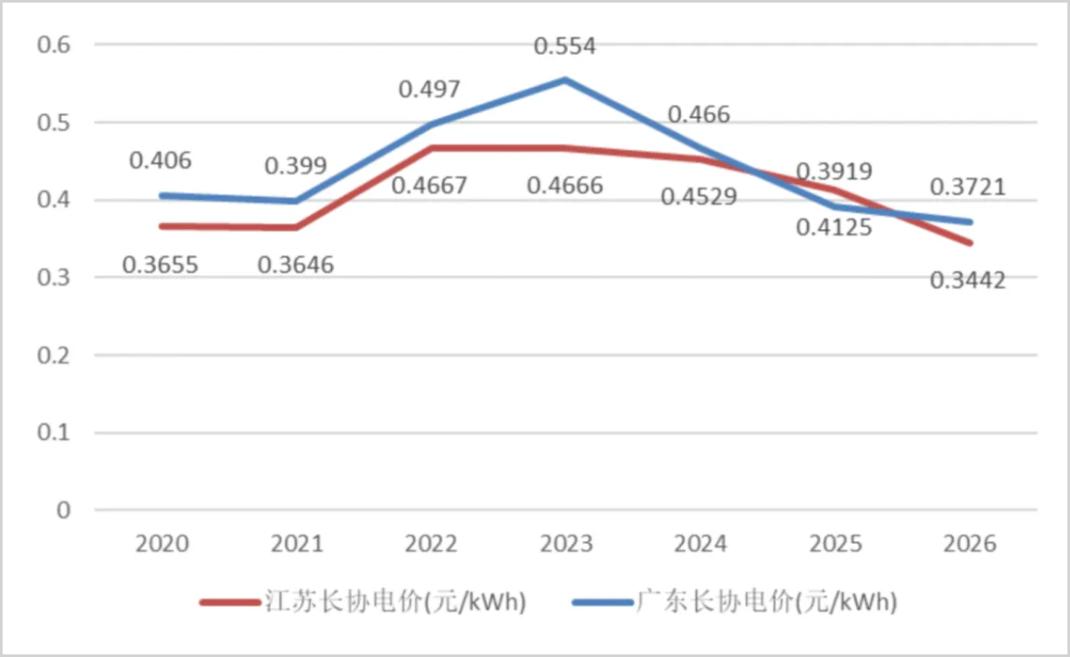
▲ Long-term contract power tariff trend of Jiangsu vs Guangdong, Source: China Merchants Bank
The power generation cost of nuclear power includes fuel cost, depreciation, operation and maintenance expenses, etc., which is generally between 0.18 and 0.21 yuan/kWh, with a slight upward trend.
At present, the market-based trading electricity volume of China National Nuclear Power and China General Nuclear Power has exceeded 50%. The end-user power tariff continues to weaken, while the cost side is relatively rigid, so profitability is naturally under pressure.
However, in December 2025 and March 2026, Guangxi and Liaoning respectively introduced mechanism power tariff policies, which locked in returns close to the original approved price for nuclear power generation, eliminated the possibility of nuclear power losses, and stabilized the long-term profit expectation. More importantly, this mechanism power tariff policy is expected to be rolled out across the country.
On the whole, the profitability level of nuclear power operators is the most stable and relatively high among all segments. As of the end of the first quarter of this year, the gross profit margins of China National Nuclear Power and China General Nuclear Power are both close to 40%, and the net profit margins both exceed 22%. The two companies have a dividend payout ratio of about 40% over the years, which are typical dividend assets in the nuclear power track. Therefore, the capital market gives them relatively high valuations, both around 20 times, comparable to that of China Yangtze Power.
Overall, this super cycle of nuclear power will not be a one or two-year pulse market, but a structural opportunity running through the entire 15th Five-Year Plan period and even longer.
Under the cycle, the upstream uranium mine segment is a certainty track where resources dominate, the midstream equipment segment is a high-flexibility track driven by orders, and the downstream operation segment is a cash flow track with dividend defense features. Understanding this rhythm difference is more important than chasing the fluctuation of the sector.
This article is from the WeChat official account "Market Value Observer", written by Li Xiaofeidao, and published with authorization from 36Kr.