The brutal truth of the century-old stock market: 4% of companies create all the wealth.
In March this year, Hendrik Bessembinder from the W.P. Carey School of Business at Arizona State University published a paper titled *A Century of the U.S. Stock Market*. He used return data of 29,754 common stocks from the CRSP database, calculating from January 1926 to December 2025, spanning a full century.
The conclusion consists of only two paragraphs.
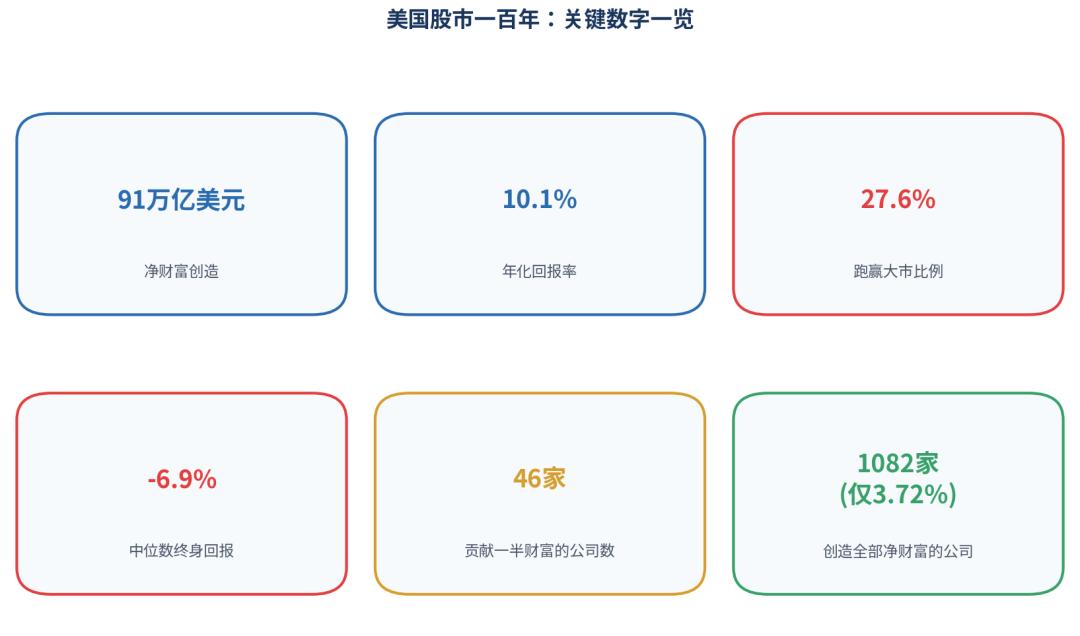
Paragraph 1: From 1926 to 2025, the U.S. stock market generated $91 trillion in net wealth over the past 100 years, with an annualized return of 10.1%, making it the most spectacular wealth engine in human history.
Paragraph 2: The power source of this engine is far more concentrated than you might imagine. Only 27.6% of stocks outperformed the broader market. Nearly 60% of stocks actually destroyed shareholder wealth, and the median stock had a lifetime return of negative 6.9%. Of the total $91 trillion in net wealth, just 46 companies contributed half of it.
Stock market returns are extremely unevenly distributed. Any stock can drop to zero, but there is almost no upper limit to how high the winners can rise. A tiny number of extraordinary companies have reaped such enormous gains that they far offset the thousands of stagnant, disappointing, or completely vanished stocks. These rare winners account for a disproportionately large share of the overall market's success.
01
The Truth of Power Law
Let's look at three sets of figures first.
The first set: Over the entire 20th century plus the first 25 years of the 21st century, the market capitalization-weighted return of the U.S. stock market was 15,040 times, with an annualized rate of 10.1%. Over the same period, the return on one-month Treasury bills was 25 times, with an annualized rate of 3.3%. Stocks outperformed bonds, outpaced inflation, beat gold, and outperformed real estate. This is the most proud report card of capitalism.
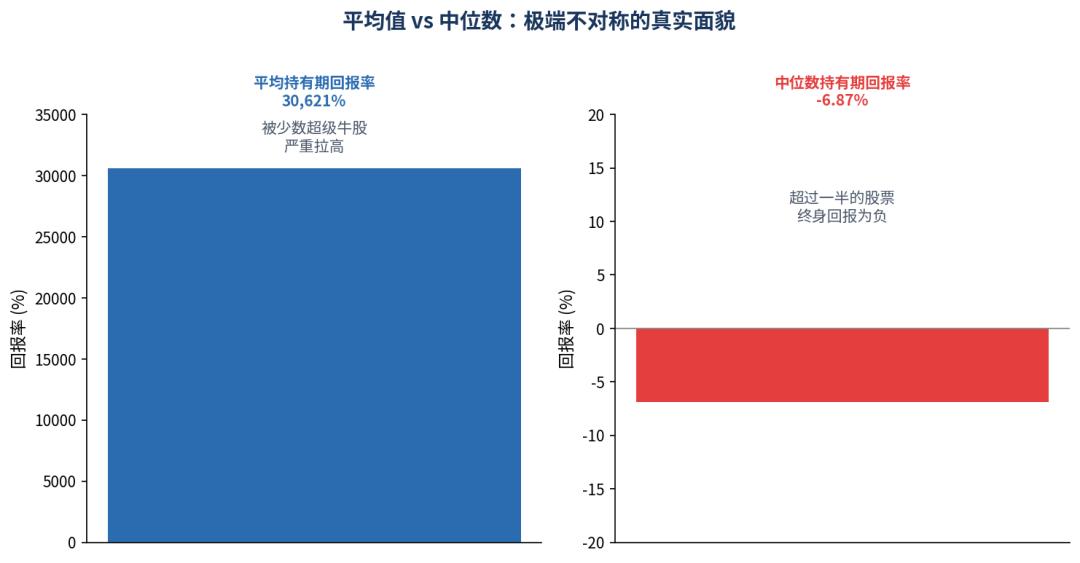
The second set: The average holding period return of all 29,754 stocks was 30,621%, but the median was negative 6.87%. The average was pulled to an extremely high level by a handful of super star stocks, while the vast majority of stocks did not make money for long-term holders at all. Only 48.22% of stocks generated positive returns, and only 41.17% of stocks outperformed one-month Treasury bills. Over the past 100 years, if you randomly bought a stock in the U.S. stock market and held it for the long term, you had more than a 50% chance of underperforming Treasury bills.
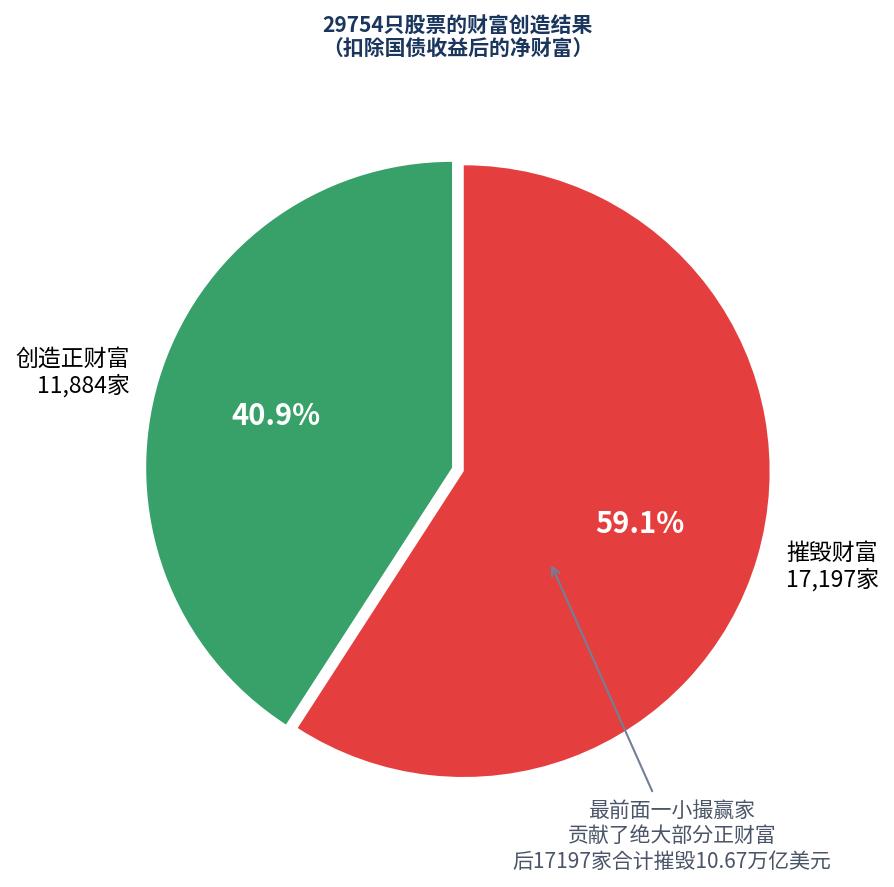
The third set: Bessembinder calculated the "shareholder wealth creation" of each company — the net wealth increment after deducting the return of Treasury bills over the same period. Among the 29,754 companies, 11,884 created positive wealth, while 17,197 generated negative wealth. But the total wealth created by these 11,884 profitable companies was far outstripped by a small group of top companies at the very front.
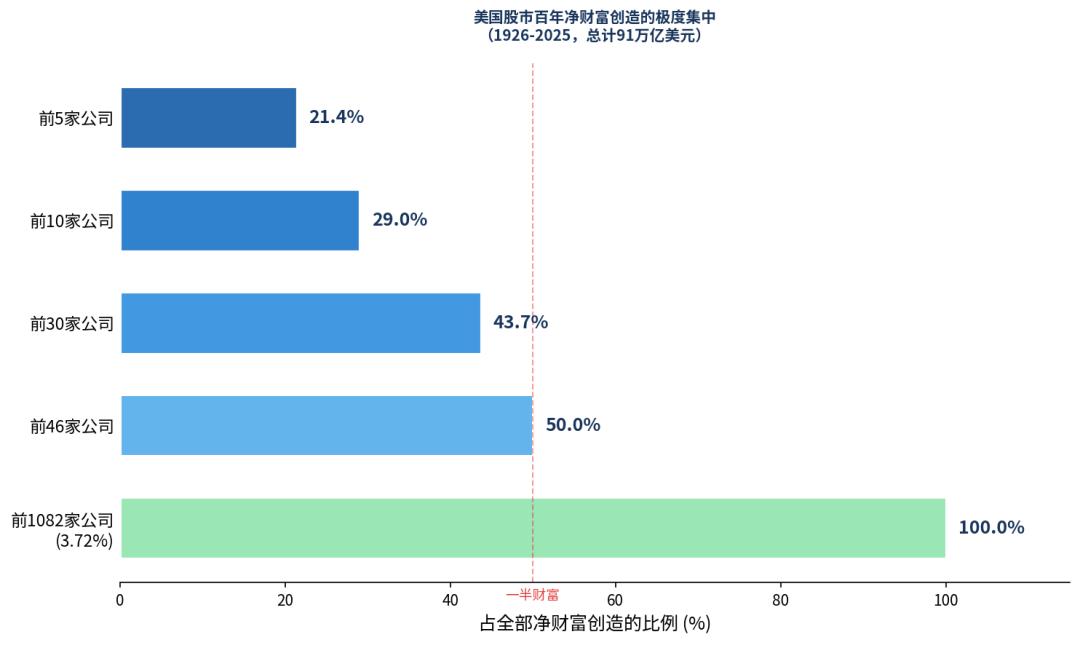
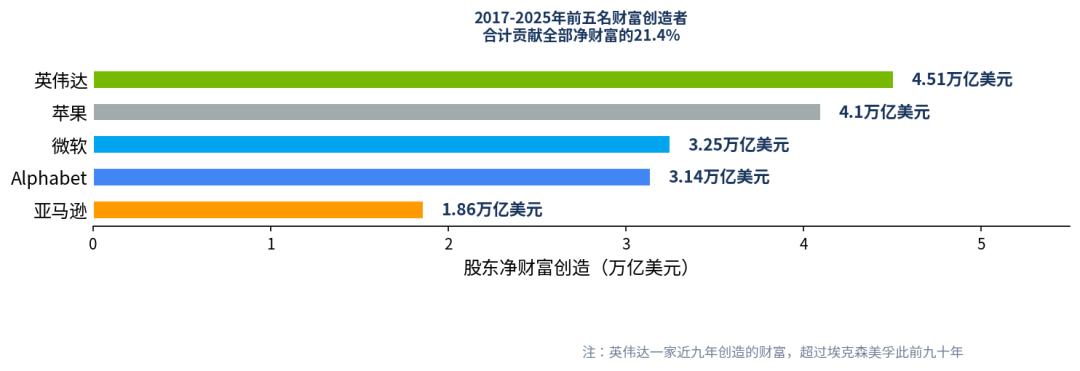
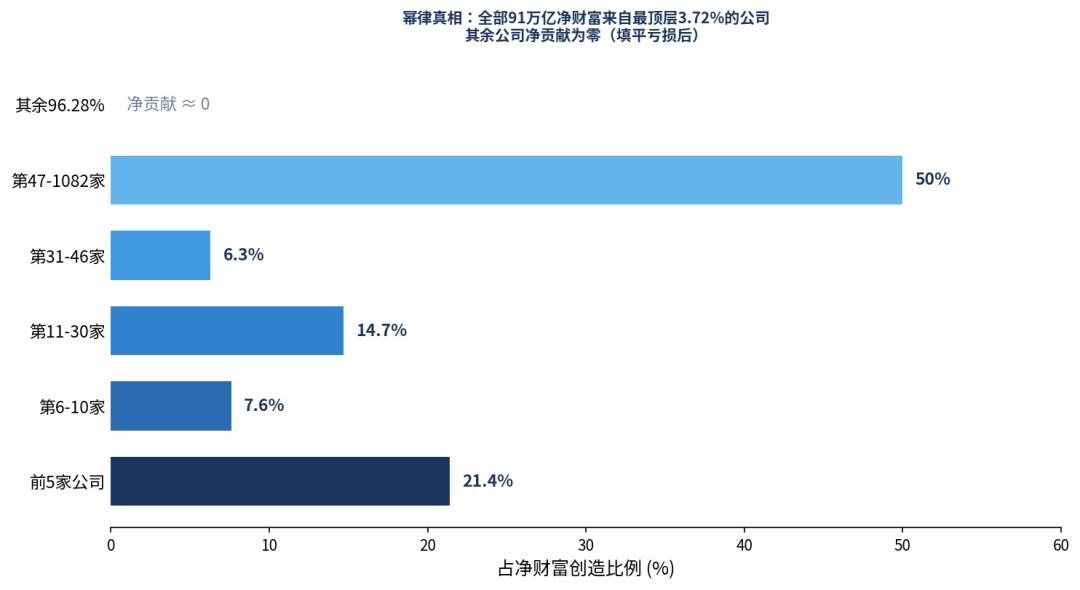
The top five companies — Apple, NVIDIA, Microsoft, Alphabet, Amazon — collectively contributed 21.4% of all net wealth creation; the top 10 contributed 29.0%; the top 30 contributed 43.7%. And the 17,197 companies at the very bottom, when added up, destroyed $10.67 trillion in shareholder wealth. The net wealth creation of the entire market is the remaining part after the small group of top winners first fill up this huge loss black hole.
This is the power law distribution. It is not the 80/20 rule, which still leaves you 20%. Instead, it is a complete reversal of the 20/80 rule: 4% of companies create all the wealth. The remaining 96% of companies combined, after deducting Treasury bill returns, generate zero net return for shareholders.
The $91 trillion created by the entire U.S. stock market over the past 100 years all came from the top 1,082 companies. If you missed these 3.72% of companies, you missed the entire century.
02
The Rotation of the Throne
These 46 companies that dominated half a century of wealth creation are not the same batch of companies that won from start to finish. They ascended to the throne in different eras, and passed on the scepter in different eras.
The kings in 1926 were ExxonMobil, General Electric, IBM, Chevron, and Altria. Their common features are old economy, heavy assets, and long-term monopoly. ExxonMobil created $1.23 trillion in shareholder wealth between 1926 and 2016, accounting for 2.89% of total net wealth creation over the same period. That was the century of oil, automobiles, electricity, and tobacco.
In the nine years after 2017, a new group of faces took the throne. NVIDIA ranks first with $4.51 trillion, Apple $4.10 trillion, Microsoft $3.25 trillion, Alphabet $3.14 trillion, and Amazon $1.86 trillion. All of them are technology companies, all founded in Silicon Valley or Seattle, and all listed within the last 40 years. The wealth created by NVIDIA alone in the last nine years exceeds the total wealth created by ExxonMobil in the previous 90 years.
Concentration is still accelerating. From 1926 to 2016, the top five companies contributed about 10% of net wealth creation; from 2017 to 2025, the top five contributed 21.4%. The top 30 companies accounted for 61.19% of wealth creation in the latter nine years, almost twice the 31.06% share in the previous 90 years. The speed of wealth creation is accelerating, and the concentration level is also climbing rapidly.
Bessembinder included an interesting comparison in his paper. The stock with the highest cumulative return in history, Altria Group (parent company of Marlboro cigarettes), ranks first with a return of 44.21 million times, with an annualized rate of 16.53%. The stock with the highest annualized return — requiring at least 20 years of data — is NVIDIA, ranking first at 37.04%.
It is worth noting that the list of companies with the highest annualized returns and the list of companies with the highest cumulative returns are two completely different sets. The reason is simple: extremely high annualized returns are often unsustainable. Stocks that can survive for a century do not rely on explosive performance, but on endurance. Altria's 16.53% annualized return does not even rank in the top 30 on the annualized return leaderboard, but it has compounded for a hundred years.
03
Global Power Law
This rule does not only apply to the United States. In a 2023 study with collaborators, Bessembinder extended the same methodology to more than 60,000 stocks worldwide. The conclusion is almost identical: Net wealth creation in the global stock market is also highly concentrated in a tiny number of companies. The top concentration in different countries and regions varies slightly, but the underlying shape of the power law distribution is completely consistent.
The reason why the power law is a power law is not due to differences in market systems or cultures, but the mathematical nature of compound interest. As long as a company's long-term return is a few percentage points higher than its rivals, after decades of compounding amplification, the cumulative wealth will be a difference of orders of magnitude. This gap cannot be easily smoothed out by diversified investment.
The success of index investing is precisely built on this power law: you do not need to identify which stocks are the winners, you only need to ensure that you hold the entire market and let the winners emerge on their own. The entire logic of index funds is to admit that you cannot predict where the power law will land, so you choose to allocate chips evenly and let time do the screening. This strategy has outperformed the vast majority of active fund managers over the past 50 years, because it humbly accepts the law of nature: predicting where the power law will land is far more difficult than accepting the power law itself.
The current outbreak of large AI models is very likely injecting new momentum into this power law. AI is a typical winner-take-all technology: the larger the computing power scale, the stronger the model; the stronger the model, the more users; the more users, the more data; the more data, the stronger the model. Once this flywheel starts to rotate, latecomers will find it very difficult to catch up. If AI really becomes the next generation of general-purpose technology platform, it may further intensify the concentration of wealth creation among top companies.
Bessembinder left a question mark at the end of his paper: Will artificial intelligence accelerate the winner-take-all trend, or level the playing field through widespread popularization, allowing more specialized companies to thrive at the same time? The answer to this question will determine whether the power law curve of the next century will be steeper or flatter. For now, the possibility of it becoming steeper is greater.
04
Winners Take All, But Winners Also Rotate
The century-old winners listed by Bessembinder — Altria, Vulcan Materials, Kansas City Southern Railway — were not the most dazzling stars in the market in any single year. Their annualized returns range from 13% to 16%, far lower than NVIDIA's 37% or Netflix's 32.5%. But they have survived for a hundred years. They have gone through the Great Depression, World War II, the oil crisis, the dot-com bubble, the 2008 financial crisis, the COVID-19 pandemic, and have survived all the way to today.
This is the other side of the power law. We often only see the spire of the power law, but ignore the silent underlying logic under the spire. The power law is indeed cruel, but it never deceives. It simply and truthfully presents the amplification effect of time on returns. How long you can survive determines how much volatility you can withstand. How much volatility you can withstand determines how long the compound return you can capture. This is the ultimate survival rule of business history: it is not about who runs faster, but about who lives longer.
The ultimate revelation of 100 years of data can be summed up in one sentence: Winners take all, but winners also rotate. And the winner that always takes all is time itself.
This article is written based on public materials, for information exchange purposes only, and does not constitute any investment advice.
This article is from the WeChat official account "Jinduan" (ID: jinduan006), author: Wei Ming, published with authorization from 36Kr.