Where is the incremental traffic in the travel and tourism industry?
Abstract
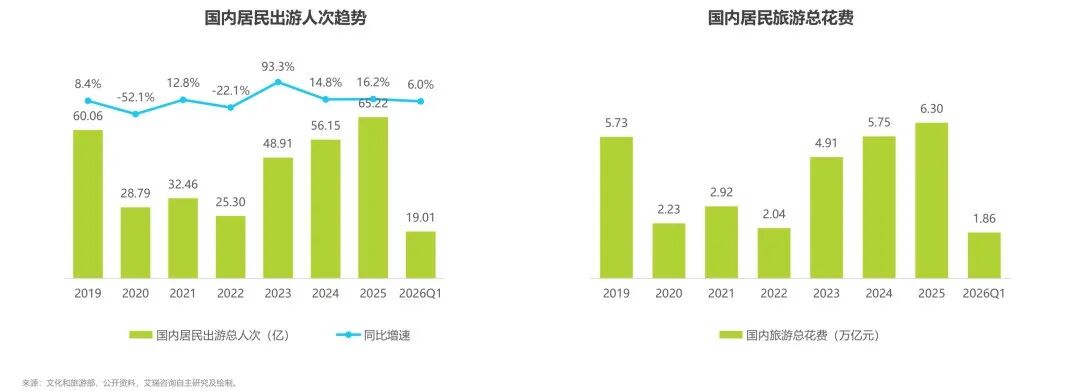
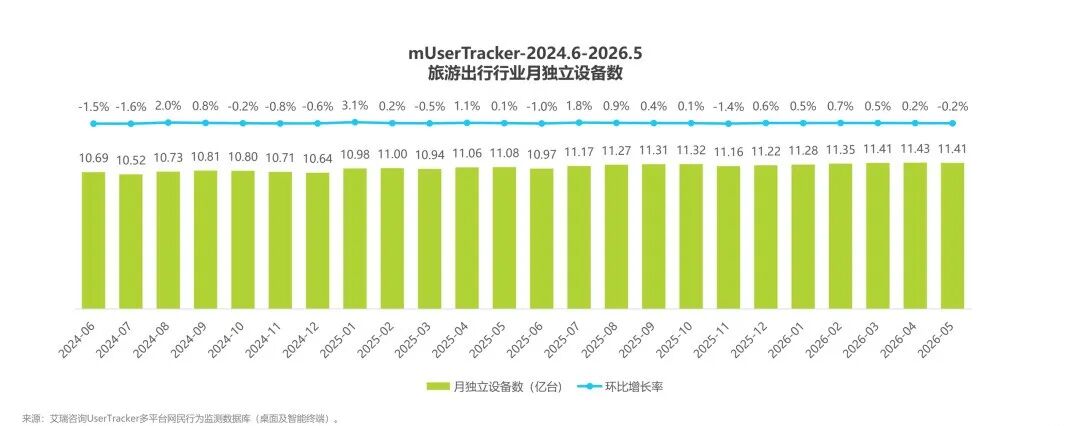
Online traffic has reached its peak, while tourism consumption continues to rise, and the two curves are diverging. In May 2026, the number of monthly unique devices in the travel industry reached 1.141 billion, a slight increase from 1.069 billion over the past two years, with the month-on-month change in most months falling within 1 percentage point; in the same period, the number of domestic tourist trips reached 6.522 billion and total tourism spending hit 6.3 trillion yuan in 2025, both exceeding the 2019 highs, and the growth rate of consumption is higher than that of tourist trips.
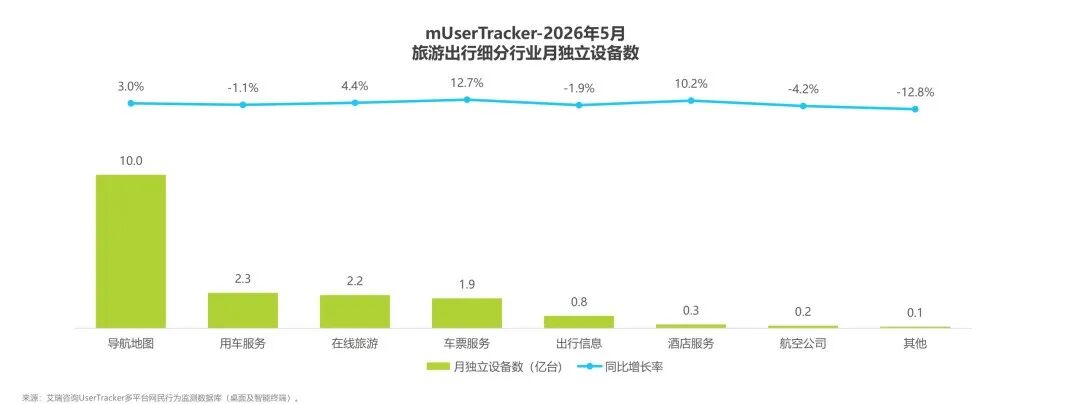
The incremental growth of the industry is highly concentrated in two tracks: hotels and ticket booking, while most other tracks are generally contracting. In May 2026, the user scale of hotel services increased by 10.2% year on year, ticket services by 12.7%, vehicle services by -1.1%, airline self-operated services by -4.2%, and other services by -12.8%; from January to May 2026, the compound growth rate of total usage duration of vehicle services was -7.42%, making it the track with the largest decline.
The window for acquiring new users from the public domain has been basically closed, and the available growth paths have shifted to mini-programs and content platforms. The CR3 of navigation maps has reached 99.6%, that of ticket services is 95.1%, and that of online travel is 92.2%; in the same period, the number of monthly unique devices for mini-programs has risen to 297 million, and the proportion of travel users on Douyin, Weibo, Kuaishou and Xiaohongshu is close to 80% on each platform.
Introduction: Two Diverging Curves
The total number of domestic tourist trips in 2025 was 6.522 billion, and total domestic tourism spending reached 6.3 trillion yuan, higher than the 6.006 billion trips and 5.73 trillion yuan in 2019 respectively. The figures on the online side tell a different story: in June 2024, the number of monthly unique devices in the travel industry was 1.069 billion, and it reached 1.141 billion in May 2026 two years later. The month-on-month change in most months during this period was within 1 percentage point, and it was -0.2% in May 2026. Consumers are spending more, but there are hardly any new devices to capture in the online market.
I. The Recovery in Volume Has Ended, and Growth in Quality Has Begun
The year-on-year growth rate of tourist trips has dropped from 93.3% in 2023 to 14.8% in 2024 and 16.2% in 2025, and further fell to 6.0% in the first quarter of 2026, indicating that the industry has entered a stage of steady growth. The curve on the consumption side is steeper: total domestic tourism spending in 2025 reached 6.3 trillion yuan, far exceeding the historical high of 5.73 trillion yuan in 2019, and the total spending in the first quarter of 2026 was 1.86 trillion yuan, maintaining a strong upward trend. The growth rate of total consumption is higher than that of tourist trips, which means that the per capita spending of tourists on a single trip is rising, and quality travel and high-unit-price products have more room for growth.
The distribution of holidays also presents a stepped pattern. The 9-day Spring Festival holiday in 2026 set a historical peak of 596 million tourist trips; the 5-day May Day holiday ranked second with 325 million trips; the two 3-day holidays of New Year's Day and Qingming Festival recorded 142 million trips and 135 million trips respectively. The amplification effect of multi-day consecutive holidays on cultural and tourism consumption far exceeds that of ordinary small long holidays.
II. The Ceiling of 1.141 Billion Devices and the Shortening Stay Time
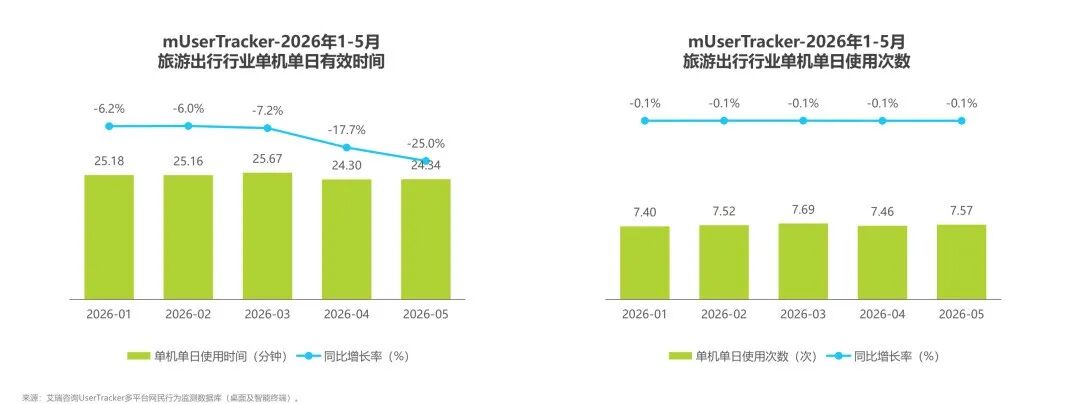
From January to May 2026, the effective daily usage duration per device in the travel industry was 25.18, 25.16, 25.67, 24.30 and 24.34 minutes respectively, with the year-on-year decline expanding month by month from -6.2% to -25.0%; in the same period, the number of daily uses per device ranged from 7.40 to 7.69 times, almost no change year on year. The opening frequency has not changed, but the stay time per session is shortening rapidly — quick browsing and instant order placement have become the mainstream, and deep long-browsing behaviors are decreasing.
The stickiness of top applications changes in the same direction. In May 2026, the effective daily usage duration per device of AutoNavi decreased by 23.6% year on year, Baidu Maps by 28.4%, Tencent Maps by 18.8%, and Didi Chuxing by 21.3%. The only platform that achieved double growth in usage duration and opening frequency is Ctrip, with the effective usage duration increasing by 10.5% year on year and the number of uses increasing by 15.6%, while its number of monthly unique devices in the same period was -3.2%.
III. Only Two Incremental Tracks: Hotels and Ticket Booking
In May 2026, the number of monthly unique devices in each sub-track showed a clear gap: 1 billion for navigation maps, +3.0% year on year; 230 million for vehicle services, -1.1%; 220 million for online travel, +4.4%; 190 million for ticket services, +12.7%; 80 million for travel information, -1.9%; 30 million for hotel services, +10.2%; 20 million for airlines, -4.2%; 10 million for others, -12.8%.
The compound growth rate from January to May 2026 divides the tracks into three tiers:
Growth tracks: the compound growth rate of user scale of hotel services is 0.95%, and that of ticket services is 0.71%; in terms of total usage duration, hotel services is 3.22%, online travel is 1.05%, and ticket services is 0.64%, with two-way growth in user scale and usage duration.
Stable tracks: the compound growth rate of user scale of online travel and navigation maps is 0.34% and 0.33% respectively, remaining basically flat.
Declining tracks: the compound growth rate of user scale of airline self-operated services is -1.36%, others -0.63%, travel information -0.48%; the compound growth rate of total usage duration of vehicle services is -7.42%, which is the largest decline among all tracks.
Navigation maps occupy a special position. In May 2026, it accounted for 81.8% of the total industry user usage duration, compared with 77.5% a year ago; the proportion of vehicle services dropped from 16.7% to 9.7% in the same period, and the number of daily openings per device also dropped from 11.4 times to 8.2 times. The traffic base is getting more and more stable, but the base itself does not generate transactions. The two types of booking businesses, hotels and ticket services, are the real sources of incremental growth.
IV. CR3 Has Locked Up the Public Domain
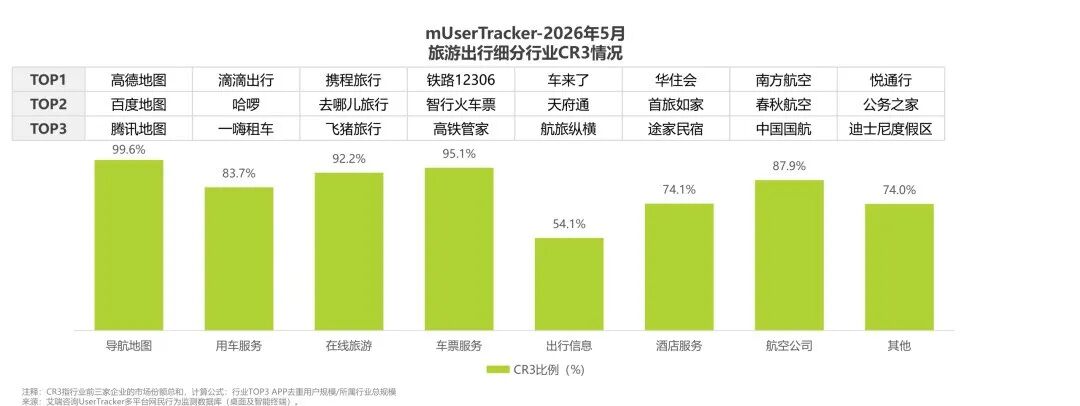
In May 2026, the CR3 of navigation maps reached 99.6%, with the top three being AutoNavi, Baidu Maps and Tencent Maps; the CR3 of ticket services was 95.1%, represented by 12306.cn, TrainPal and High-Speed Rail Butler; the CR3 of online travel was 92.2%, represented by Ctrip, Qunar and Fliggy. The CR3 of airlines reached 87.9%, vehicle services 83.7%, and hotel services 74.1%, all of which have formed a stable head camp. The track with the lowest concentration is travel information, whose CR3 is only 54.1%, leaving room for small and medium players to survive.
In the stock market, small and medium platforms can hardly win by acquiring new users from the public domain, and can only dig deep into segmented scenarios and operate vertical users. The performance of sub-tracks confirms this point: the number of monthly unique devices of Douyin Local Life reached 8.6 million, a sharp increase of 74.7% year on year; Aranya achieved explosive growth among scenic spot applications, with a year-on-year increase of 3241.1%; Damai for performance ticketing recorded 57.23 million units, up 29.0% year on year. In the same period, most homestay platforms declined, with Meituan Homestay down 31.3% and Xiaozhu Homestay down 23.6%. The overall scale is not large, but the growth rate is concentrated in vertical scenarios.
V. Two Rising Entrances: Mini-Programs and Content Platforms
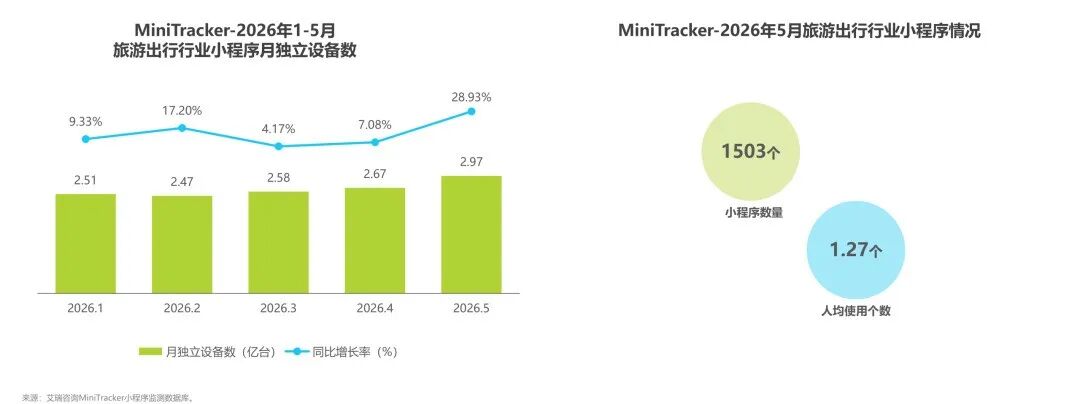
The traffic of mini-programs continues to rise, but it is extremely scattered. The number of monthly unique devices of travel mini-programs increased from 251 million in January 2026 to 297 million in May, with a year-on-year increase of 28.93% in May. There are 1503 mini-programs in the whole industry, and each user only uses 1.27 of them on average. The daily active users show obvious holiday pulses, forming short-term peaks on New Year's Day, Spring Festival, Qingming Festival and May Day. 6 of the top 10 mini-programs belong to vehicle services, and the Didi Chuxing mini-program ranks first with 123 million units, up 29.1% year on year; the daily active users of the vehicle track is close to 14 million, the highest among all sub-tracks, with more than 280 mini-programs; the number of travel information mini-programs is the largest, close to 340, but the daily active users are only about 2.8 million, making it difficult for a single mini-program to gain a large share of users.
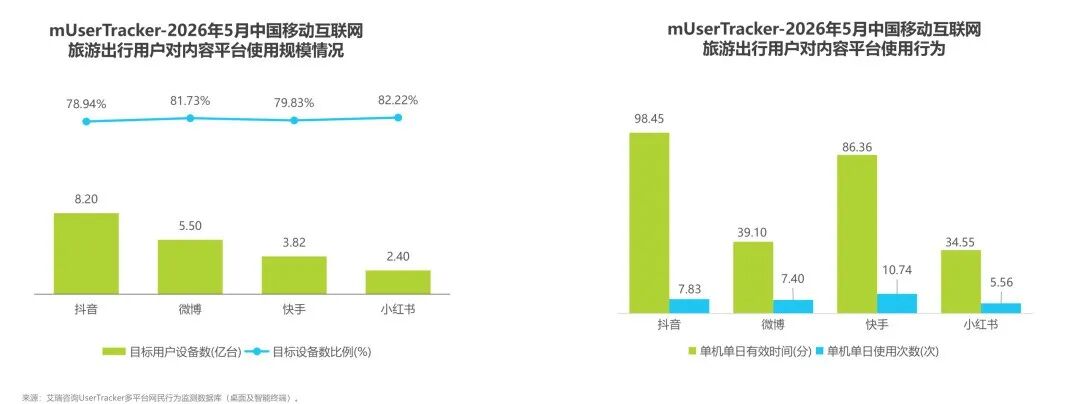
Among the users of Douyin, Weibo, Kuaishou and Xiaohongshu, the proportion of travel users is close to 80% on each platform. There is little difference in user coverage between platforms, but the gap lies in stay time. In May 2026, the number of travel users on Douyin was 820 million, Weibo 550 million, Kuaishou 382 million, and Xiaohongshu 240 million, accounting for 78.94%, 81.73%, 79.83% and 82.22% of the total users of their respective platforms. In terms of stay time, the daily usage duration per device on Douyin is 98.45 minutes, Kuaishou 86.36 minutes, Weibo 39.10 minutes, and Xiaohongshu 34.55 minutes, with short video platforms far exceeding social graphic platforms.
The conversion of grass-planting traffic is divided into three paths:
Short videos mount platform mini-programs, and users click the mounted mini-program directly while watching short videos or live streams to complete the order.
Content cards and comment areas guide users to jump to the mini-programs of brands or OTAs in the WeChat ecosystem to complete the booking.
After being attracted by the content, users actively go to the app store to download apps such as Ctrip and Qunar to complete long-distance travel booking.
The grass-planting positioning of the four platforms is also different: Douyin creates county-level cultural tourism hits, importing millions of grass-planting traffic at one time; Weibo aggregates cultural tourism discussions through hot searches and super topics, and the same check-in spots recommended by celebrities and KOLs trigger follow-up trends; Xiaohongshu uses strategy guides and note collections to precipitate decision lists, releasing demand intensively during holidays and diverting traffic to OTAs to complete high-unit-price bookings of air tickets and hotels; Kuaishou uses dialect short videos plus group tour packages to accurately capture travel traffic from the silver-haired group in the sinking market.
Conclusion
The industry has fully entered stock competition. The growth rate of online device scale has slowed down significantly, and the focus of user operation has shifted from acquiring new users in the incremental market to refined operation of existing users. The growth direction is clear: on the macro side, it is quality travel and high-unit-price products supported by rising per capita single-trip spending; on the online side, it is the two types of booking businesses of hotels and tickets; on the channel side, it is the rising daily active users of mini-programs and content platforms with a penetration rate close to 80%. For platforms outside the CR3, competition for public domain traffic is no longer a viable option, and the available space for growth lies in in-depth operation of vertical segmented scenarios and existing users.