First-tier Market Survey of 13 Cities: The Real Estate Market Remains Strong in the Traditional Off-season
The month-on-month transaction data of new and second-hand homes in July confirms one fact: the traditional off-season has arrived.
However, if we extend the observation timeline, the conclusion will be totally different.
Compared with July 2025, both new home and second-hand home transactions have achieved a 3% positive growth. Among the 20 key cities, 16 recorded a year-on-year rise in new home transactions, and 13 saw positive year-on-year growth in second-hand home transactions.
More intuitively, the average monthly transaction center of new and second-hand homes since April has increased by 35% and 21% respectively compared with the average level of the first quarter. The transaction center of second-hand homes has even hit a new high in nearly three years.
After summarizing the frontline market judgments from Pure City Institution, we draw a new conclusion: the real estate market in August will most probably be "not weak in the traditional off-season".
From the perspective of the whole year, the month-on-month figures in July and August will decline, but the decline will be far more moderate than that of the first two months of the year. The market will pick up in the traditional peak sales seasons of September and October, and remain stable in November and December.
In one sentence: the market performance in the second half of this year will not be too bad.
01
The decline in July is a pullback from a high level rather than a break of the upward trend.
There are two sets of core data supporting this judgment:
First, re-examine the July data with the transaction center as the reference standard: The average transaction center of new homes is 12.23 million square meters, and that of second-hand homes is 14.19 million square meters, which are 15% lower than the average center from April to July respectively. The decline ranges are highly consistent, which conforms to the characteristics of the traditional off-season; but they are still 14% and 3% higher than the average center of the first quarter respectively. From January to July, the cumulative transaction of new homes in 50 key cities reached 89.93 million square meters, with a cumulative year-on-year decrease of 9%; the cumulative transaction of second-hand homes in 20 key cities reached 107.94 million square meters, with a cumulative year-on-year increase of 12%. The scissors gap of about 21 percentage points between the two indicators is still continuing.
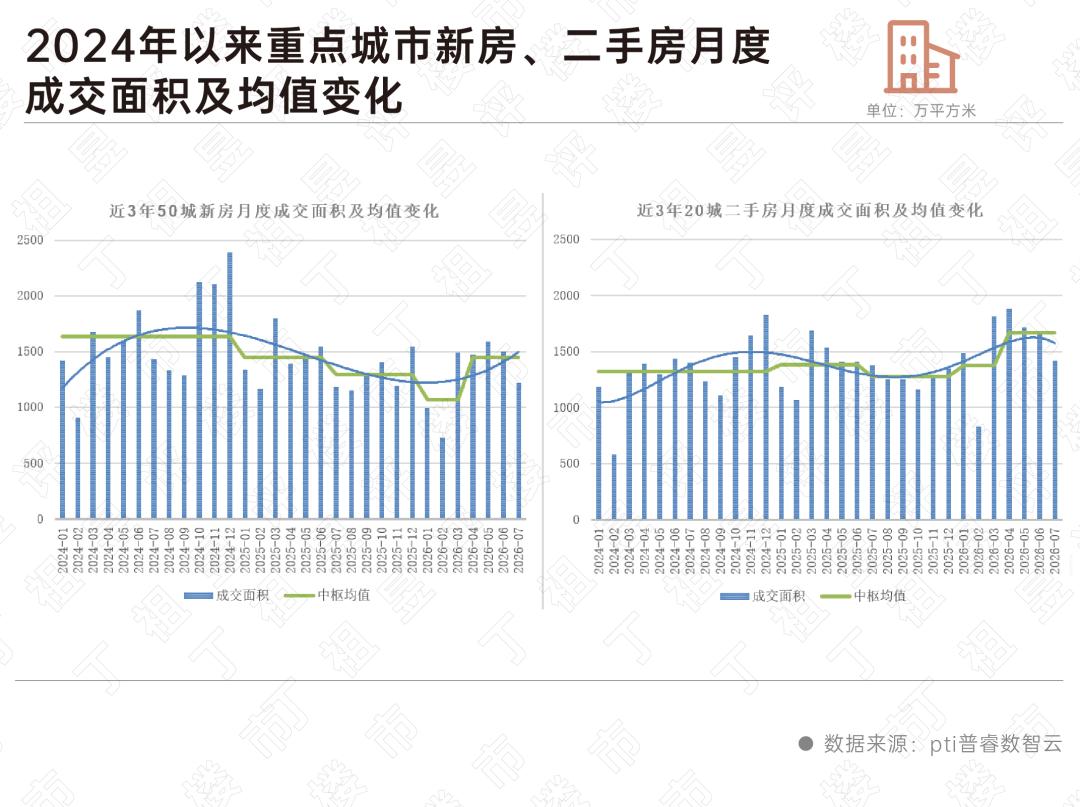
Second, the year-on-year performance at the city level is another direct supporting evidence: Among the new home transactions of 20 key cities in July, only 4 cities including Chongqing, Xi'an, Chengdu and Hangzhou saw a year-on-year decline, the remaining 16 cities did not record further year-on-year drops (15 of them achieved positive growth, and Wuhan remained flat). There are 13 cities with positive year-on-year growth in second-hand home transactions, and as many as 16 cities recorded positive cumulative year-on-year growth, with only 4 cities including Hangzhou, Qingdao, Guangzhou and Nanjing showing negative cumulative year-on-year growth.
Among the 12 cities that have complete data for both new and second-hand homes, the total transaction volume of second-hand homes in July reached 11.71 million square meters, 2.4 times of the 4.94 million square meters of new homes: 3.9 times in Beijing, 3.8 times in Shanghai, 3.2 times in both Chengdu and Suzhou, 2.9 times in Hefei, and 1.2 times in relatively balanced Guangzhou and Xi'an.
Compared with new homes, the recovery of second-hand homes is stronger in both breadth and sustainability, and the substitution effect of second-hand housing scale is also very clear.
02
Positive signals have emerged from the frontline market judgments of 13 key cities for the August market.
First, the supply side shows a moderately positive trend in the off-season, with more cities seeing rising supply than those seeing shrinking supply. The positive signals on the supply side directly support the judgment that the property market in August will be "not weak in the off-season".
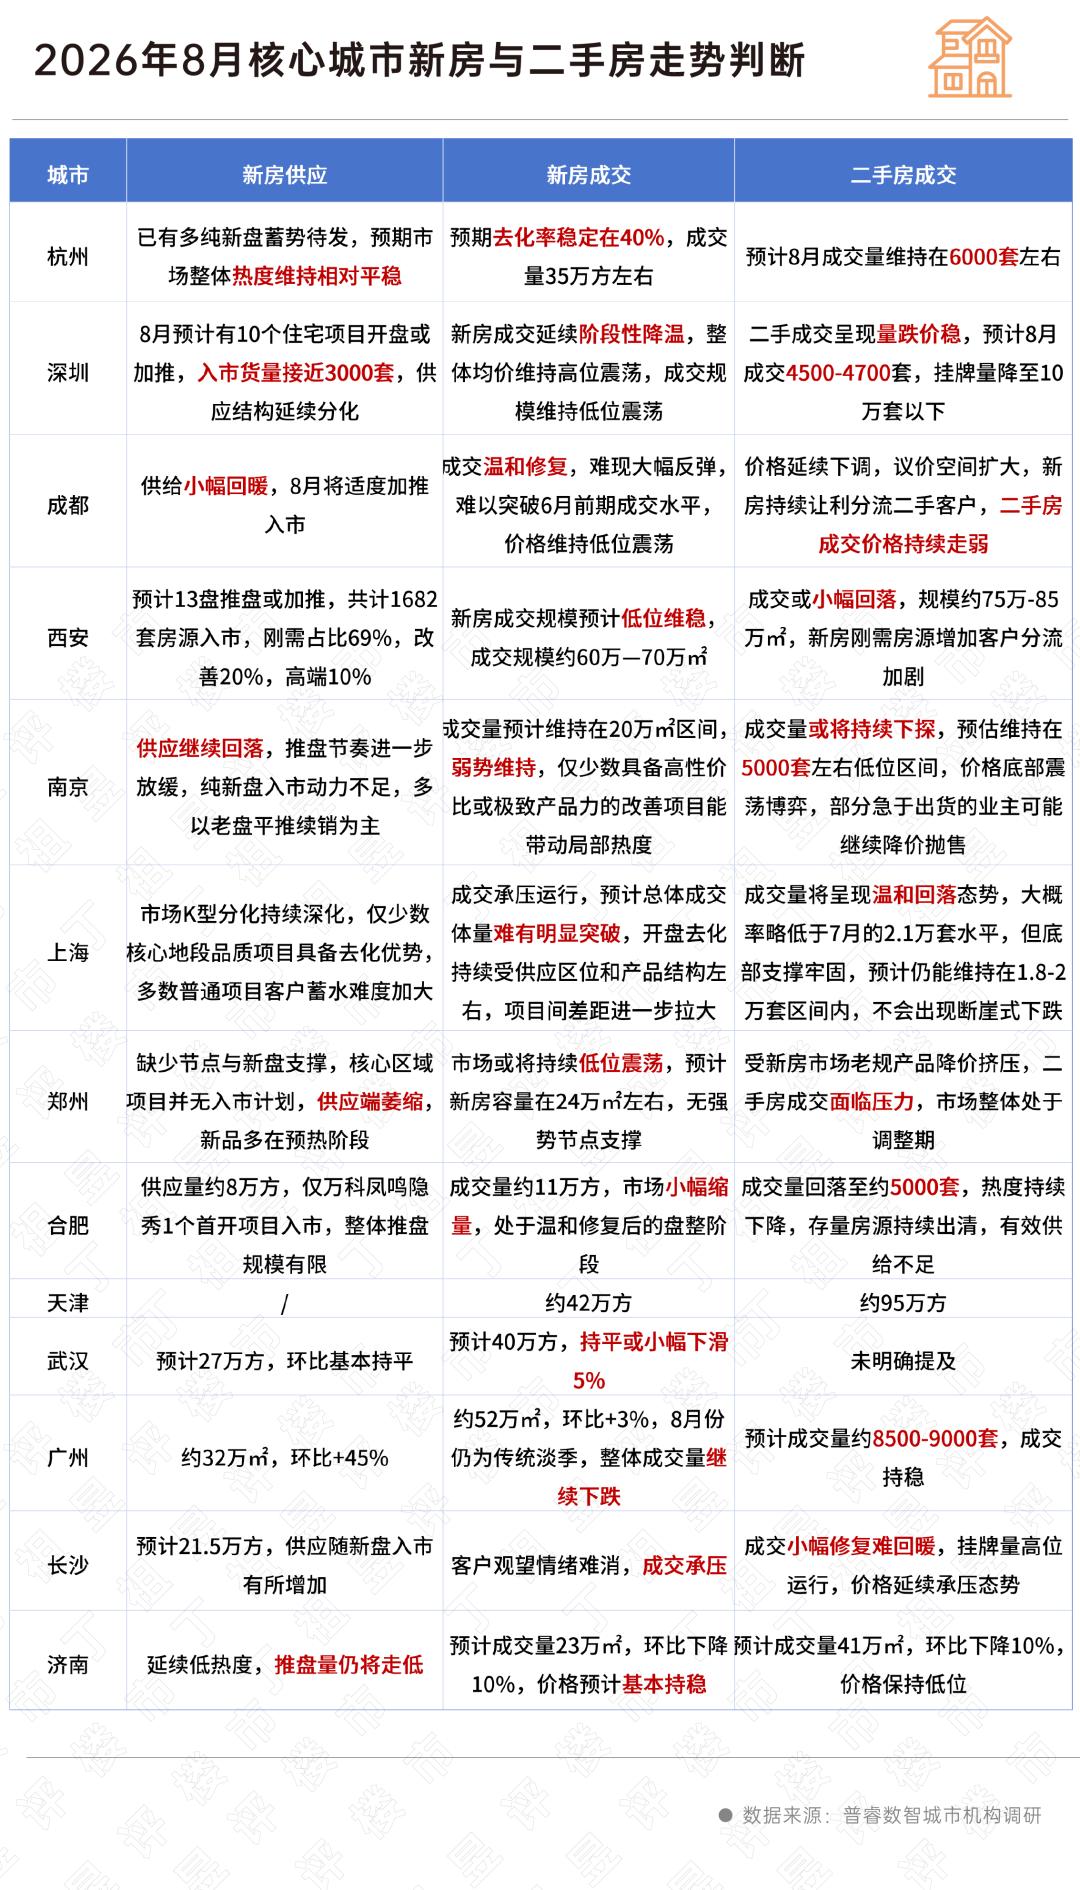
From the perspective of specific cities: Shenzhen: The new supply is expected to bottom out and rebound, with nearly 3,000 units from 10 projects entering the market; Guangzhou: The supply is about 320,000 square meters, up 45% month-on-month; Xi'an: It is expected that 1,682 units from 13 projects will enter the market, of which 69% are for rigid demand, 20% for improved demand, and 10% for high-end demand; Chengdu: Real estate developers moderately launch more housing units, and the supply recovers slightly; Changsha: The expected supply is 215,000 square meters; Hangzhou: Multiple brand-new projects are poised to launch.
The core contradiction on the demand side is not that the demand has disappeared, but that the wait-and-see sentiment of home buyers has solidified and their decision-making rhythm has slowed down significantly. The frontline survey feedback from 13 cities is highly consistent.
From the perspective of specific cities: Changsha: The wait-and-see sentiment of customers is hard to fade; Nanjing: Only projects with high cost performance or extremely outstanding product competitiveness can drive local market heat; Shanghai: Most ordinary projects face greater difficulty in accumulating potential customers
This feature has been confirmed in the de-inventory performance of projects in July. High-quality real estate projects with precise positioning and core advantages can still achieve hot sales. The Xingyao · Muqingyun project in Hangzhou Binjiang achieved rapid sales with precise positioning targeting rigid and improved demand groups, and was completely sold out right after its first opening; the Lvcheng Yunshu project in Wuhan deeply targeted local improved demand groups and achieved a full sell-out on the opening day. In sharp contrast, a large number of ordinary projects without differentiated advantages or price competitiveness have sluggish de-inventory performance, with the overall de-inventory rate only remaining at the low level of 10%-30%.
Based on this, the 13 cities have reached a highly consistent prediction on new home transactions in August: maintaining stability at a low level. The expected fluctuation is basically within the range of ±10%. The narrowing of fluctuation itself is also a manifestation of "not weak in the off-season".
Specific to each city:
Guangzhou: Expected to increase by 3% month-on-month; Wuhan: Remain flat or decline slightly by 5%; Hangzhou: The de-inventory rate will stay stable at 40%; Jinan: Expected to decline by 10% month-on-month; Hefei and Shenzhen point to "slight volume shrinkage"; Xi'an, Tianjin, Nanjing, Zhengzhou and Chengdu all use expressions such as "maintaining stability at a low level" and "maintaining a weak trend"
The judgments of the 13 cities on the second-hand housing market are mostly "stable", "maintaining the current trend" and "slight decline".
Shanghai: 18,000-20,000 units with "solid bottom support"; Guangzhou: 8,500-9,000 units and "stable"; Hangzhou: About 6,000 units; Nanjing and Hefei: About 5,000 units; Shenzhen: 4,500-4,700 units.
The transaction price of second-hand homes is almost unanimously trending downward. The 3% year-on-year growth of second-hand home transactions in July is based on price concessions, and the "trading volume for price" trend in the second-hand housing market will continue in August.
Chengdu: The price will continue the downward channel, and the negotiation space for buyers will keep expanding; Nanjing: Some owners who are eager to dispose of their properties may continue to cut prices to sell; Changsha: The number of listed properties remains at a high level, and the price continues to face downward pressure; Jinan: The price remains at a low level.
According to the strength of the market expectation in August, the 13 cities can be divided into three tiers. The first tier includes Shanghai, Shenzhen and Guangzhou, where both supply and transaction show positive signals, and the bottom support of first-tier cities is prominent; The second tier includes Hangzhou, Wuhan, Tianjin and Xi'an, where the transaction scale is basically stable and the supply side sees a short-term recovery and equilibrium; The third tier includes Nanjing, Zhengzhou, Hefei, Jinan, Changsha and Chengdu, presenting a "three weak" pattern of shrinking supply, pressured transaction and downward second-hand housing market.
Finally, the judgment that the August property market is "not weak in the off-season" can be verified through three core dimensions.
The first is the total volume bottom line. Whether the new home transactions in 50 key cities in August can hold the line of 13 million square meters, and whether the second-hand home transactions in 20 key cities can stabilize at 15 million square meters. This is the bottom standard that the market will not see a trend of continuous weakening.
The second is structural recovery. Whether the number of cities with positive year-on-year growth can remain more than half. Compared with the total transaction volume, this data can better reflect the coverage and equilibrium degree of market recovery.
The third is leading indicators. Whether the number of customer visits to projects in August can stop falling and rebound, which will also affect the performance of the traditional peak sales seasons of September and October.
Since the second quarter, the transaction center has risen steadily and the second-hand housing market has continued to strengthen, which has already confirmed the core logic of the current market: home purchase demand has not disappeared, but has been reallocated under the triple screening of price adjustment, product iteration and liquidity differentiation. The "not weak in the off-season" performance in August is essentially a stress test of this round of market recovery at the seasonal low point.
This article is from the WeChat Official Account "Ding Zuyi Comments on the Property Market", written by Pure Research and the Editorial Department, and published with authorization from 36Kr.