These 10 charts are the most closely watched by top tech traders at Goldman Sachs, reflecting the profound evolution of AI investment logic.
At the critical node where the AI wave is reshaping the landscape of the technology sector, Peter Callahan, top TMT trader at Goldman Sachs, sorts out 10 core observations and 10 key charts, outlining the most important structural shifts in current technology investment: AI agent (silicon-based) traffic is surpassing human (carbon-based) traffic, optical components are outperforming memory chips, and open-source models are achieving better performance at less than 8% of the cost of closed-source models — three sets of contrasts reflect the deep evolution of the investment logic of AI infrastructure.
In the August 9 report, Callahan maintains a position-building judgment on the trend of the technology sector in August and beyond, with reasons including the position structure is becoming clean, technical pressure is easing, valuation is relatively reasonable, and fundamentals and earnings performance are strong.
Last week, the Nasdaq 100 index rose 5% in a single week, and the VIX closed near 14, hitting a new low for the year, and the discussion on the Fed's policy path temporarily faded into the background after the non-farm payroll data was released.
At the industry level, this earnings season has further widened the sentiment divergence between data infrastructure and development tool companies and traditional SaaS application vendors — the former is switching from the AI "headwind" narrative to the AI "tailwind" narrative, and whether the latter can keep up with this narrative shift will be the focus of the market in the next stage.
At the same time, signals such as the continued tightness of GPU computing power, the proportion of non-human network traffic exceeding 50%, and the rapid expansion of enterprise AI budgets all point to an "inference economy" that is taking shape at an accelerating pace.
01
Three major structural themes: Agents, Optics, Open Source
Agents are replacing humans as the protagonist of the Internet.
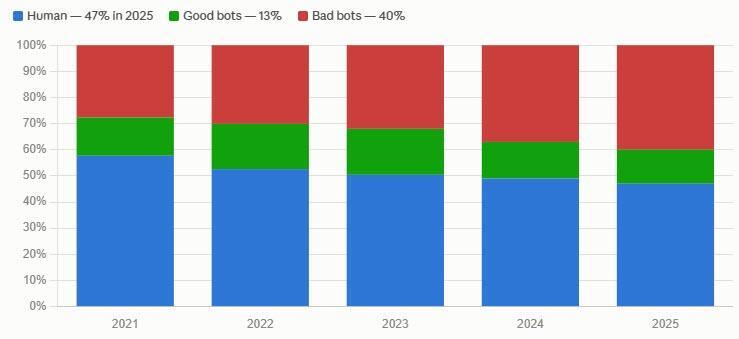
Cloudflare disclosed on the earnings call that non-human traffic has exceeded human traffic, and predicted that if the current trend continues, non-human traffic will be 1000 times that of human traffic five years later — "Humans will become a rounding error on the Internet".
Third-party data also shows that in 2025, robot traffic has accounted for 53% of the total network traffic, and the proportion of human traffic is less than half.
Enterprise AI budgets are expanding, but ROI divergence has emerged.
Booking stated that AI investment has achieved positive returns, and the related costs are still at a low single-digit level of the overall technology expenditure; MercadoLibre invested about 80 million US dollars in AI this quarter, and disclosed that the size of customer service staff has dropped from 10,000 to 7,000 against the background of a 3-fold increase in business volume, and 90% of customer interactions no longer require manual intervention.
Open-source models are challenging the closed-source ecosystem at extremely low cost.
Pinterest disclosed in its earnings report that by post-training the open-source model on proprietary data, its performance surpasses that of the closed-source third-party model, and the cost per transaction is less than 8% of the comparable closed-source model. This data directly challenges the business model of closed-source AI models, and also provides a strong practical application-level footnote for the market debate of "open source vs closed source".
Goldman Sachs' recent sales and trading report characterizes the current market as "returning to normal rather than booming", and describes the slowdown in earnings growth as "structural change rather than direction reversal". Louis Miller, partner of Goldman Sachs, concluded with a market maxim:
"The trend is your friend until it bends in the end."
02
Disney — Breakthrough or Breakdown?
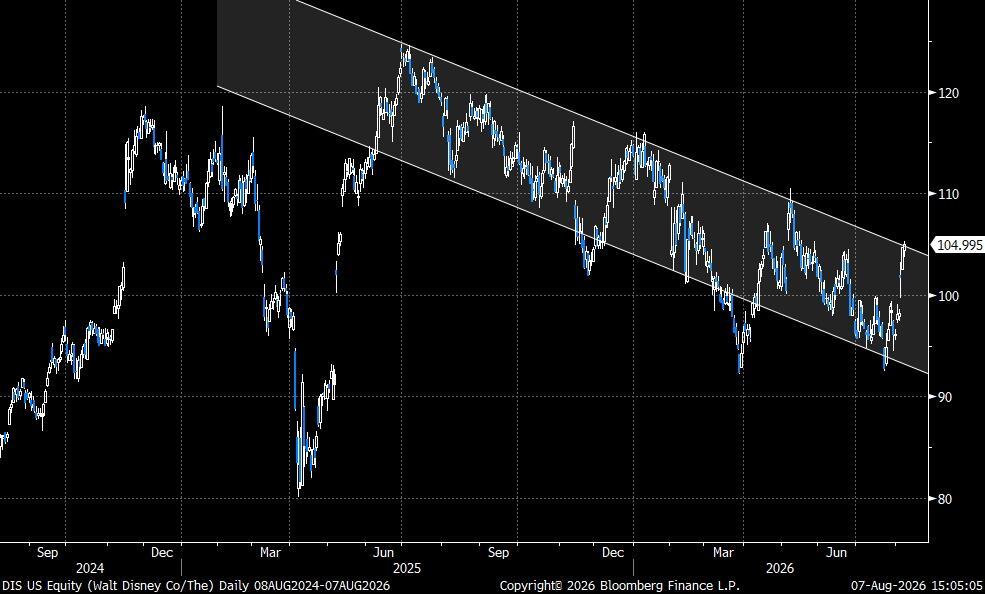
Disney delivered a strong report card this quarter, with the attendance rate of domestic theme parks accelerating and rebounding, but the market's controversy over the space for earnings revisions has not dissipated. From a technical perspective, the DIS stock price has been operating in a downward channel for several years, and is currently at a critical node — whether it will break upward or move downward again has become the core concern of investors.
03
Optics vs Memory — The most notable sector divergence this quarter
This is one of the topics Callahan has received the most client inquiries about this week. Since the third quarter, both optical stocks (blue line) and memory stocks (red line) have experienced a pullback of about 30% in July, but after entering August, optical stocks have outperformed memory stocks by more than 20 percentage points cumulatively.
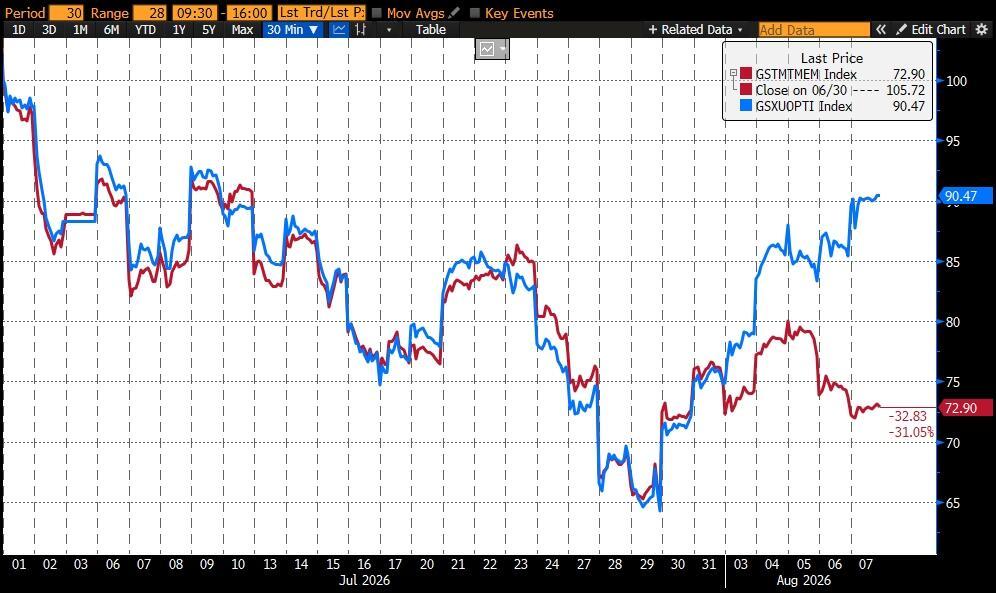
Specifically, Coherent has risen for 7 consecutive trading days, with an interval increase of 73%; Lumentum rose 43% in the same period, Fabrinet rose 36%, Corning rose 34%, and Ciena rose 24%. In contrast, the gains of NAND, DRAM and hard disk drive (HDD) memory targets in the same period are generally between 0 and 20%, significantly lagging behind. Behind this divergence is the market's re-pricing of the computing power demand structure in the AI inference stage — the outbreak speed of optical interconnection demand is exceeding previous expectations.
04
Block — Can the stock price catch up with fundamentals?
The stock price of payment service provider Block (black line) has long hovered in the low range of 80 US dollars, while its gross profit (blue line) continues to rise, and the divergence between the two is becoming increasingly significant.
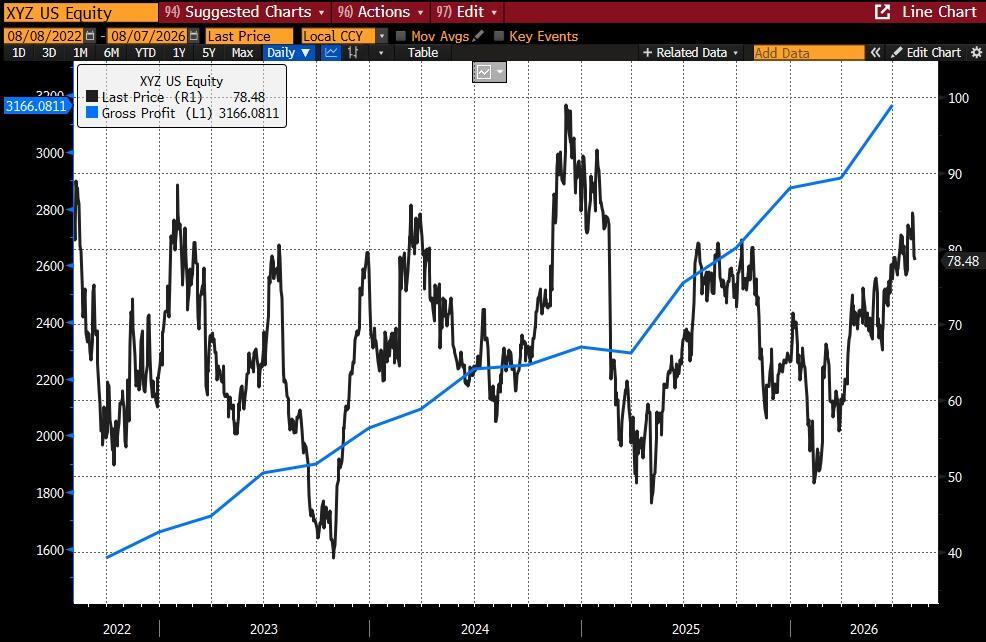
This chart marked by Goldman Sachs trader Christian DeGrasse raises a core question: Can the stock price eventually converge to fundamentals and achieve an upward repair?
05
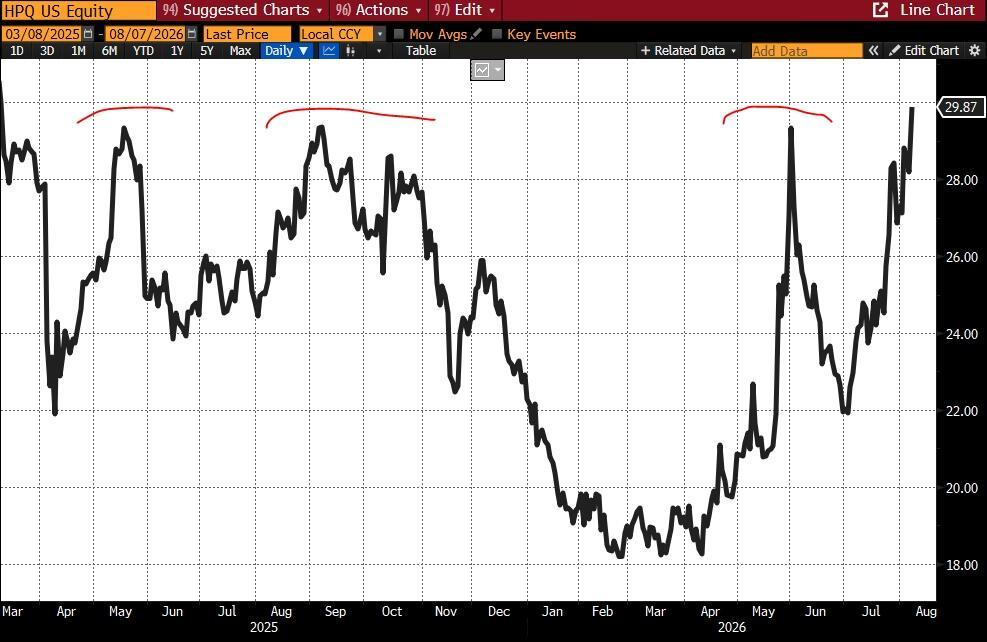
HP — Up 40% in 40 days, key resistance ahead
HP's stock price has quietly risen by about 40% in 40 trading days, and is retesting the key resistance level of about 30 US dollars — this position has acted as a "ceiling" many times in the past year. Whether it can break through effectively will be an important signal to judge the nature of this round of rebound.
06
SaaS Observation — The ice-breaking moment above the 200-day moving average
Although the focus of market conversations is on finding beneficiaries of the "inference economy" (such as Snowflake, Cloudflare, Palantir, CrowdStrike, Palo Alto Networks, etc.), Callahan pointed out that ServiceNow closed above the 200-day moving average for the first time in more than a year, a signal that cannot be ignored.
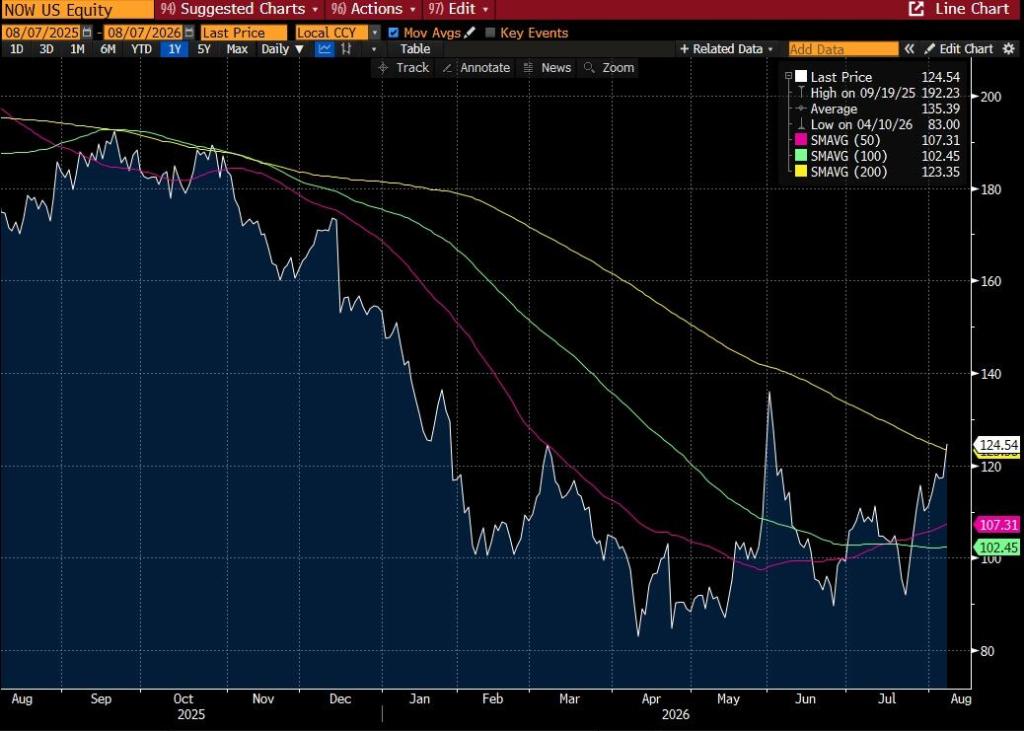
This also echoes his core judgment on SaaS/application companies: as non-quarterly earnings reports of Intuit, Adobe, Salesforce and other companies are released intensively, the market will closely observe whether these companies can also build their own AI "tailwind" narrative.
It is worth mentioning that Atlassian has rebounded by about 160% cumulatively from the low point of the year, but it is still down about 6% year-to-date — this contradictory data itself is the epitome of the current situation of the SaaS sector.
07
Nvidia — A belated catch-up rally?
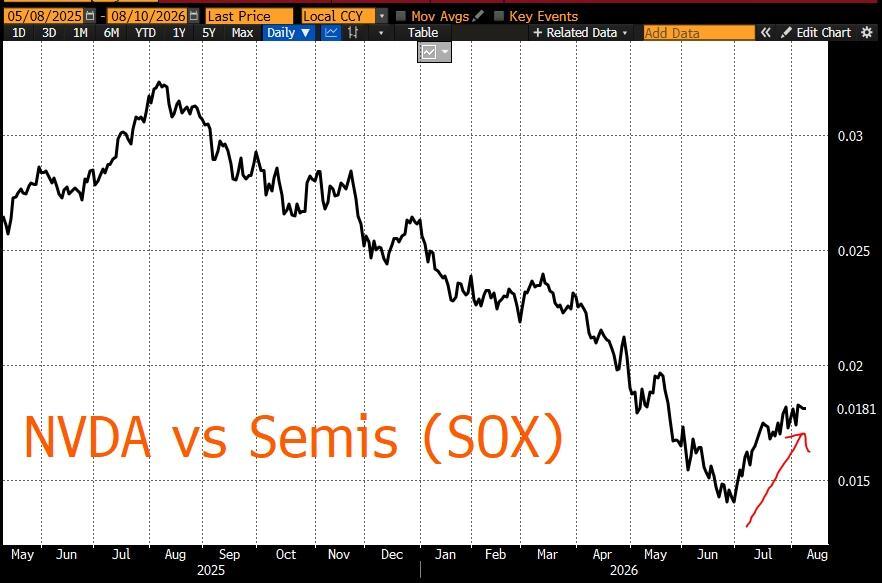
Nvidia rose 11.5% last week, posting its best single-week performance since May 2025. Callahan believes that the catalyst path is evolving in a favorable direction — the upcoming earnings report, the release of the Vera Rubin architecture, and the dense industry conference season together constitute the potential driving force for NVDA's catch-up rally.
The chart shows the relative trend between Nvidia and the Philadelphia Semiconductor Index (SOX), and Nvidia's relative strength is re-establishing.
On the GPU computing power supply side, the tight situation continues.
Akamai said on the earnings call: "GPU demand remains exceptionally strong, and all of our GPU capacity is completely sold out." This is in the same line as previous statements from cloud vendors such as Microsoft and Amazon.
08
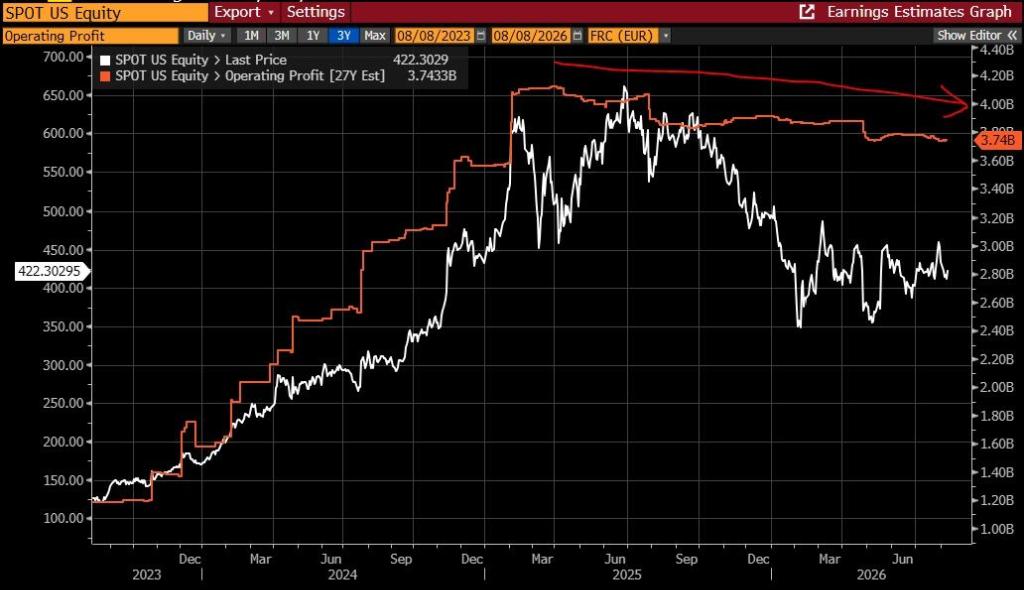
Spotify — Divergence between positive sentiment and downward revisions
Investor sentiment around Spotify's AI music releases is quite positive, but the chart reveals a worrying reality: over the past nearly two years, the company's operating profit forecast (orange line) has been continuously revised down, while the stock price (white line) has remained high driven by sentiment.
Callahan's judgment is concise and direct: "same ol' story" — the divergence between sentiment and fundamentals is the core contradiction that this stock has faced for a long time.
09
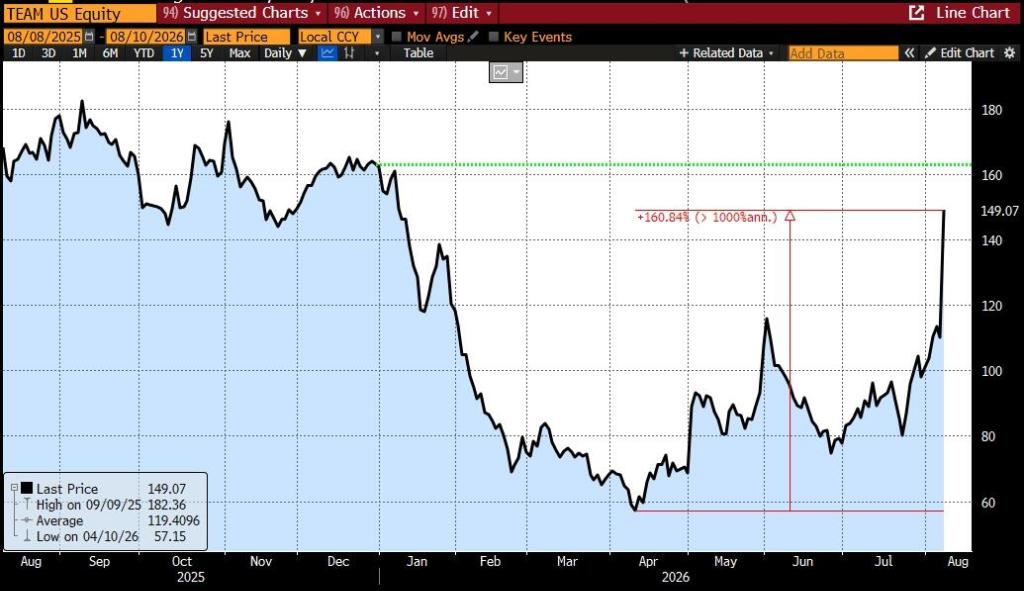
Atlassian — Two consecutive 30% single-day surges, still losing money year-to-date
Atlassian has achieved a T+1 single-day increase of more than 30% for two consecutive earnings seasons, driving its stock price to rebound by about 160% cumulatively from the year's low. However, this chart reveals a dramatic fact: even so, TEAM still recorded a negative return year-to-date. This data not only shows how deep the previous decline was, but also reminds investors to carefully evaluate the safety margin when chasing higher prices.
10
UBER — GARP logic emerges
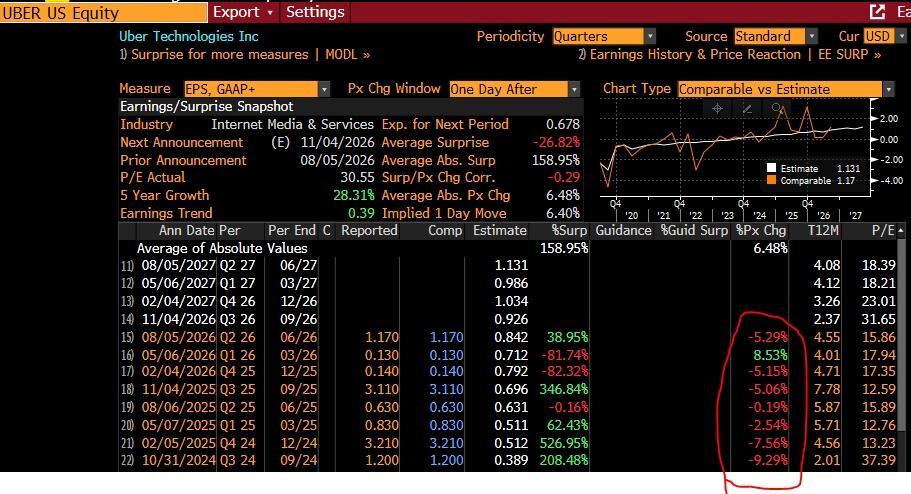
Uber has once again presented the pattern of "earnings exceeding expectations, stock price rising and then falling back", but the stock price has risen by about 15% cumulatively in the past two weeks, and clear GARP (Growth at a Reasonable Price) and value investment logic has begun to appear in investor conversations — the roughly 13x forward free cash flow corresponds to a mid-to-high single-digit to double-digit revenue growth rate, and the valuation attractiveness is attracting institutional attention.
11
Q2 Earnings — Information Technology leads the S&P 500
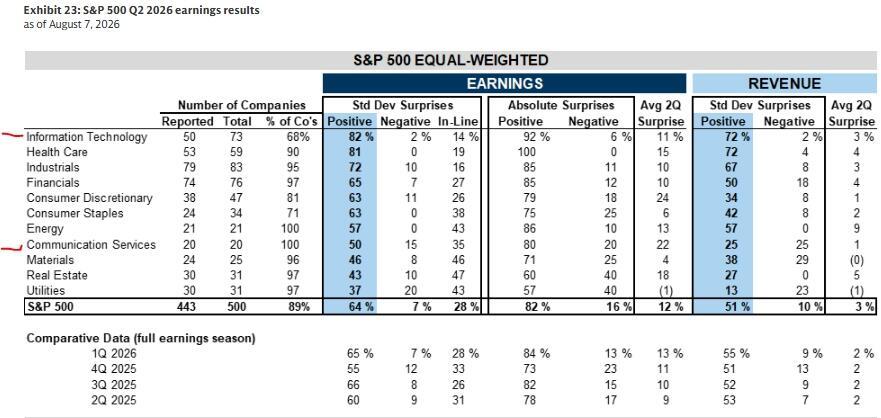
The information technology sector led the S&P 500 in the Q2 earnings season, with 82% of constituent companies beating earnings expectations and 72% of companies beating revenue expectations. This data provides the most direct fundamental support for Callahan's position-building judgment on the technology sector.
This article is from the WeChat official account "Wall Street CN", author: Dong Jing, 36Kr publishes with authorization.