Has the worst of the AI bull market passed? Wall Street: The real test has only just begun.
Wall Street has just gone through its most brutal market stretch in months. Tech stocks led the decline, bond yields surged, and oil prices fluctuated sharply — the combination of multiple pressures has plunged investors into deep anxiety: Has the worst moment for the market already passed?
In July, the Nasdaq Composite Index posted a cumulative decline of 3.2%, marking its worst monthly performance since March this year; the S&P 500 edged down 0.1%, and only the Dow Jones Industrial Average recorded a tiny monthly gain of 0.3%.
Meanwhile, the technical rebound in the last two days of the month brought a brief respite, but Brian Garrett, a top derivatives trader at Goldman Sachs, warned that last week's buying was more of a "gross down" of short covering rather than genuine long position building — this key distinction means the foundation for the market to stabilize is still not solid.
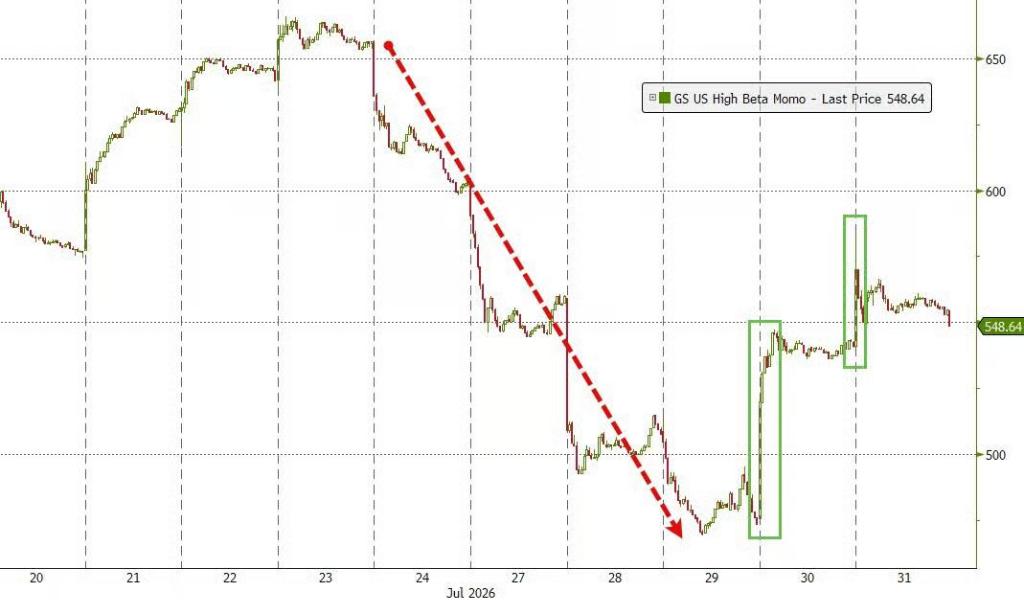
The return of inflation, unclear interest rate prospects, and doubts over the sustainability of AI capital expenditure have formed three major shackles suppressing tech stocks. Garrett clearly pointed out that this week's non-farm payroll data and interest rate trends will become the key touchstone to test whether the previous rebound is a return of real demand or just a position washout.
Inflation Returns to the Core Market Narrative
Callie Cox, chief market strategist at Ritholtz Wealth Management, believes that investors must prepare for more market volatility — inflation has re-emerged as the dominant force driving the broader market.
"I'm not saying (the decline) will definitely happen, but the current environment is complex enough, we face too many high-level indicators, and once the market turns upward, the recovery path will probably not be smooth," Cox told MarketWatch, "Right now inflation is the biggest risk facing equity portfolios, and at the same time, economic growth lacks resilience before the end of the year."
Recent data shows that inflation has shown signs of cooling at least in June, with the latest Consumer Price Index (CPI) and Personal Consumption Expenditures (PCE) data both falling back. But the renewed rise in oil prices in July puts this progress at risk of reversal.
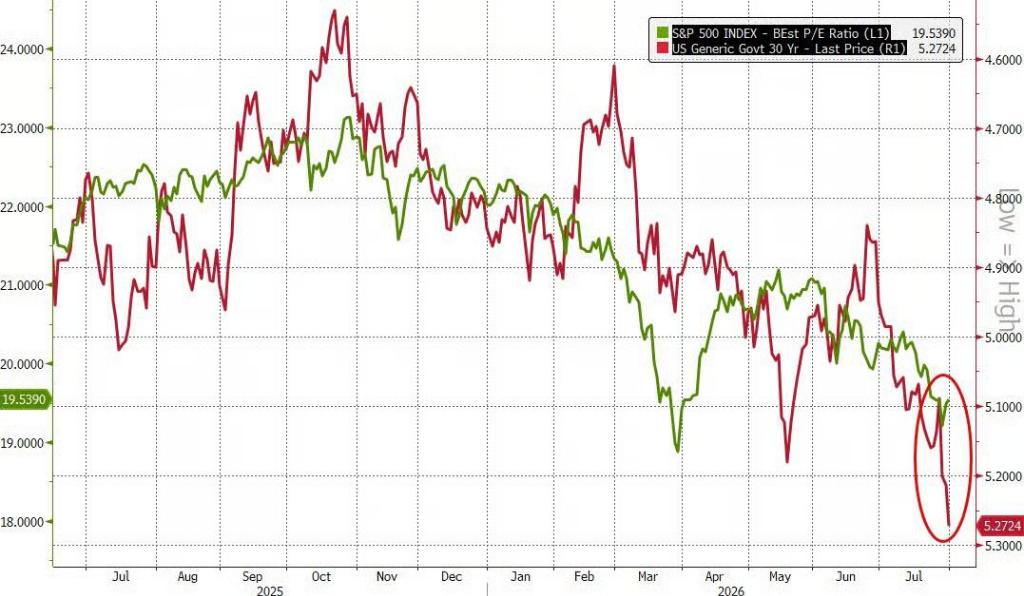
Cox pointed out that the current drivers of inflation are essentially different from the 2022 price crisis triggered by supply chain disruptions and large-scale fiscal stimulus, but after nearly four years of strong bull market gains, interest rate uncertainty and inflation pressure are high enough to "continuously disturb" stock prices.
AI Demand Cost Pressure Transmits to Tech Stocks
Hidden inflation risks do not only come from energy prices, the AI investment boom itself is also creating new cost pressures.
Brian Kersmanc, portfolio manager at GQG Partners, pointed out that the prices of key inputs such as memory chips, which are heavily consumed by data centers and AI infrastructure, continue to rise, and enterprises may eventually pass on this part of the cost to customers, further pushing up inflation.
"Inflation is largely sentiment-driven," Kersmanc said:
"If people believe inflation is coming, they will spend and act in accordance with that expectation. So the longer inflation lasts, the more likely it is to become self-reinforcing."
This logic is particularly dangerous for highly valued interest rate-sensitive sectors — especially chip stocks. A large part of the expected revenue and profits of such companies come from the distant future, and when the discount rate rises due to high interest rates, the present value of these future cash flows will shrink significantly.
However, Kersmanc also pointed out a reverse positive effect: High interest rates not only compress valuations, but also curb enterprises' willingness and ability to spend capital expenditures. "From this perspective, inflation may even be more beneficial to hyperscale cloud providers, because what the market is most worried about now is precisely their overly aggressive capital expenditure," he said.
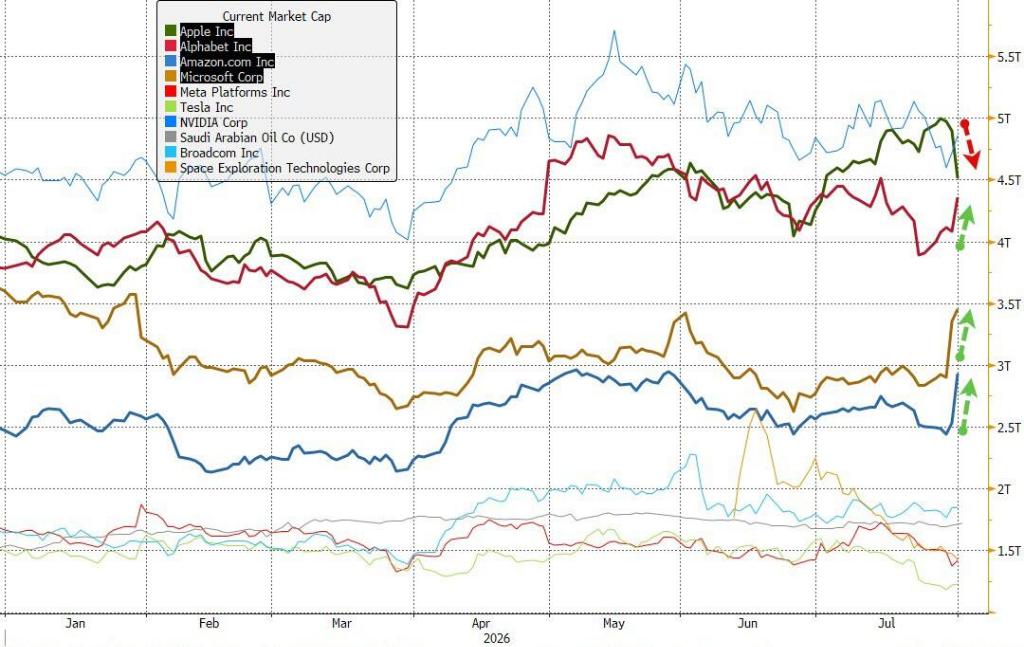
Data from Goldman Sachs confirms this differentiation logic: last week's large-cap tech stock earnings season showed extremely disparate market reactions — Apple's market value evaporated by about 50 billion U.S. dollars in a single day, Meta fell nearly 8%; while Amazon and Microsoft both rose by more than 15%, with Microsoft setting the record for the largest single-day increase in market value in history (about 550 billion U.S. dollars).
Under the Calm Surface of the Broader Market, Undercurrents Are Surging
The sluggish performance of the overall market in July masks profound internal structural rotations.
According to FactSet data, the S&P 500 Equal Weight Index, which strips out the impact of market capitalization weights, actually rose 1.3% in July, while the market-cap-weighted S&P 500 fell 0.1% over the same period. Among the 11 S&P 500 sectors, 7 posted positive returns in July, and only four sectors — information technology, industrials, materials and utilities — closed lower.
Jay Hatfield, CEO and Chief Investment Officer of Infrastructure Capital Advisors, attributed this phenomenon to the continued shadow of geopolitics: "Under the overwhelming pressure of war, the only thing the market can do is rotate." He also warned that the deleveraging process of hedge funds may not be completely over, and the resulting sell-off will continue to create sustained volatility.
Goldman Sachs data provides further evidence for this: last week, the sell-off of tech stock long positions reached the largest three-day scale on Goldman Sachs' records on Tuesday, followed by signs of repositioning on Friday — the shift from historic selling to initial recovery within the same week is enough to illustrate the extreme difficulty of the current market.
The Authenticity of the Rebound Is in Doubt, Key Thresholds Are Yet to Be Broken
Even if there was a clear market rebound at the end of last week, Brian Garrett of Goldman Sachs explicitly advised prudence.
He pointed out that last week's net buying volume was the largest since November 2020, but the driving force mainly came from short covering rather than active long position additions — the ratio between the two in the derivatives market is about 2:1. This means that this round of rebound is more like a technical repair after position clearing, rather than a trend market driven by a new round of buying.
At the market structure level, the S&P 500 closed below its 50-day moving average for six consecutive trading days previously; the trend signal of CTA strategies in the U.S. market is still slightly negative, with key support levels at 7445 points and 7215 points respectively.
Meanwhile, the total assets of global leveraged ETFs have plummeted by about 60 billion U.S. dollars since June (a decline of about 28%), and the actual net exposure has shrunk sharply by about 170 billion U.S. dollars — this huge forced deleveraging pressure is still a potential hidden danger in the market structure.
Garrett currently tends to position under the assumption that the systemic deleveraging cycle is coming to an end: he uses strategies such as long volatility decline and buying 3-month call options on the S&P 500 to bet on the scenario of the market "climbing slowly".
But he also emphasized that this week's non-farm payroll data, as well as whether interest rates and corporate earnings can "verify" last Friday's rebound, will be the real test of whether this judgment holds.
This article does not constitute personal investment advice, does not represent the platform's views. The market is risky, investment needs to be cautious, please make independent judgments and decisions.
This article is from the WeChat Official Account Wall Street CN, Author: Zhang Yaqi, published with authorization from 36Kr.