Cosmetics sales reached 611.4 billion yuan in the first half of the year, and there are several important turning points behind this figure.
A few days ago, the China Fragrance, Flavor and Cosmetics Industry Association (hereinafter referred to as "CFFCA") released key data for the cosmetics industry in the first half of 2026. In H1 2026, the total omnichannel transaction value of China's cosmetics sector further expanded to 611.41 billion yuan, representing a year-on-year increase of 4.35%.
Data released by CFFCA also shows that in H1 2026, online channels recorded a total transaction value of approximately 380.887 billion yuan, up 5.74% year-on-year; offline channels achieved a total transaction value of around 230.519 billion yuan, marking a 2.13% year-on-year growth.
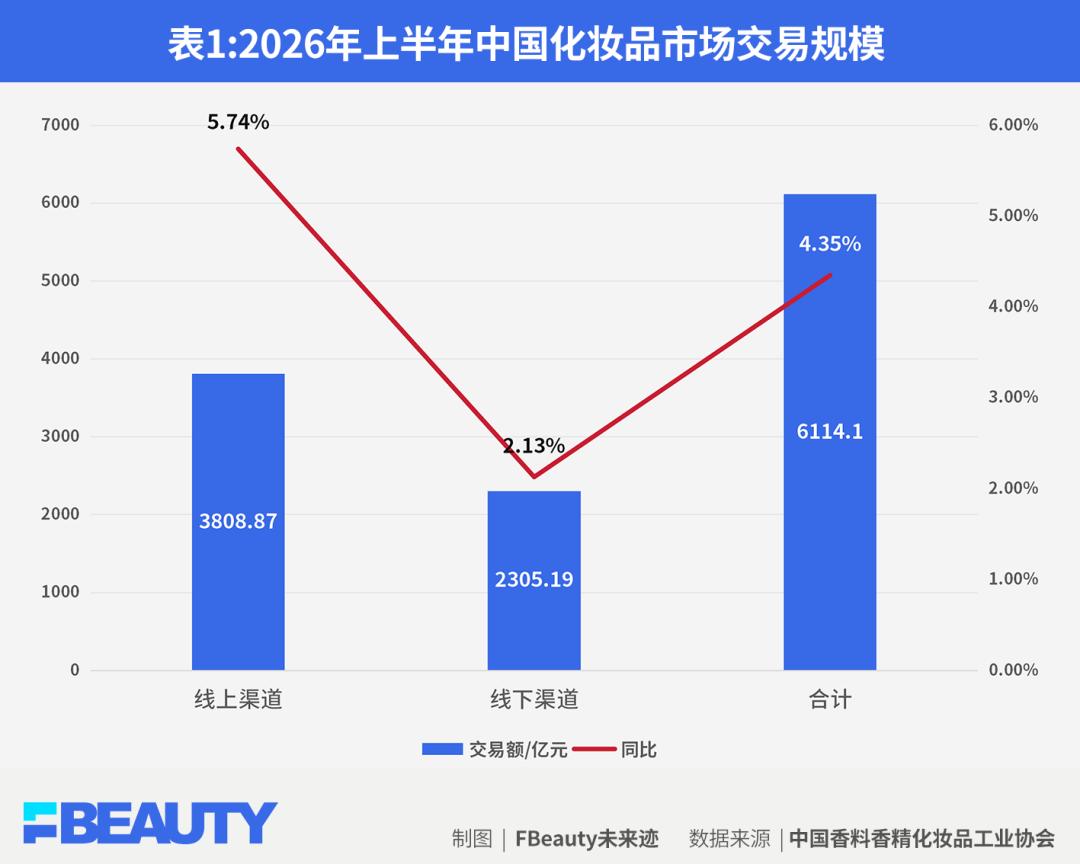
It is worth noting that this marks the first time in many years that both online and offline channels have recorded positive growth simultaneously. This reveals the ongoing structural changes taking place in the online and offline sales channels of the cosmetics industry.
Reshaped Online Channel Landscape, Live-Streaming E-Commerce Takes a Dominant Lead
Data obtained by FBeauty Future Trajectory shows that in H1 2026, live-streaming e-commerce platforms represented by Douyin have become the main channel for online cosmetics sales, with a total transaction value exceeding 210 billion yuan in the first half of the year and a market share of approximately 57%.
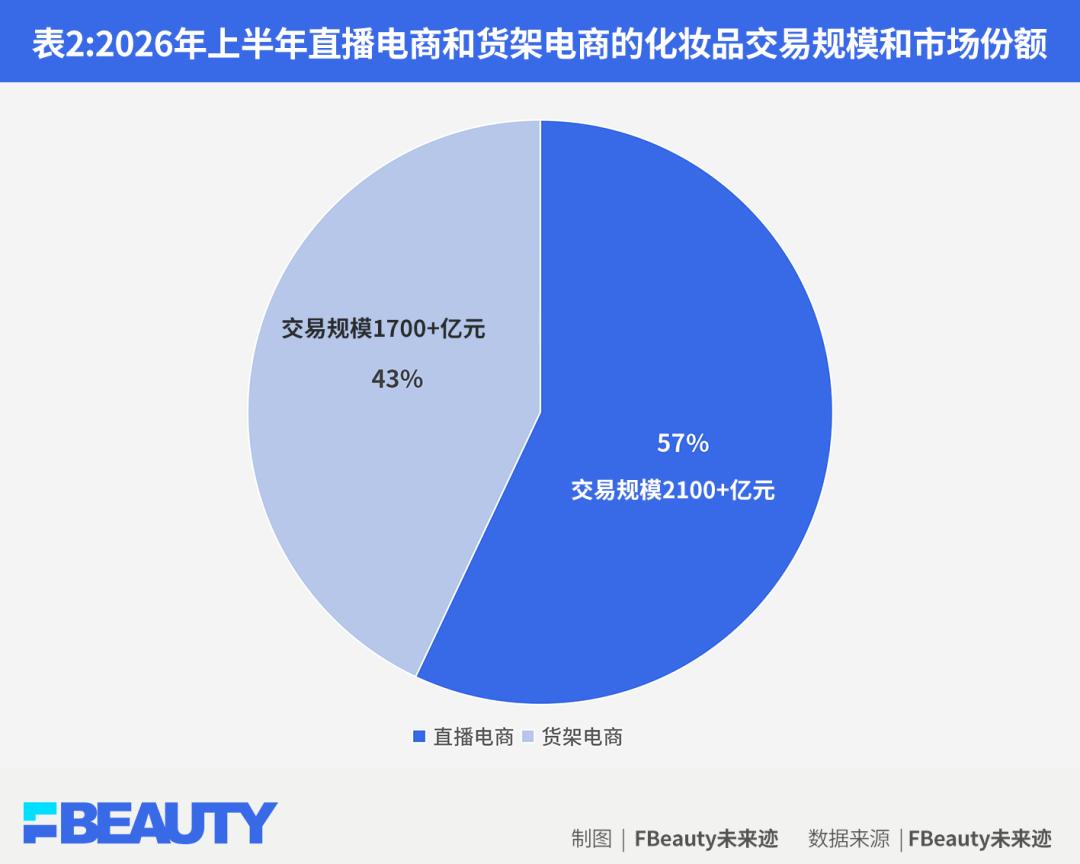
Further breakdown shows that within the live-streaming e-commerce sector, Douyin holds the highest market share. With a transaction volume of over 200 billion yuan in the online cosmetics retail space, it captures 53% of the market share and achieves an unrivaled leading position.
However, it is noteworthy that in H1 2026, the year-on-year growth rate of cosmetics transaction volume on Douyin is far higher than that of transaction value, which suggests that Douyin is likely currently caught in a scenario of "trading price for volume". Promotional mechanisms in live streams, bundled set discounts, and influencers cutting prices — this strategy works flawlessly when scaling up, but it is quietly reshaping consumers' price expectations. Whether Douyin can maintain high growth in the second half of the year deserves further observation.
In addition, Tmall, Taobao, and JD.com are all undergoing in-depth adjustments. Their average transaction prices in H1 2026 have all increased, showing an overall feature of "improving quality while reducing volume". In the second half of the year, they will likely further optimize their product and brand structures, concentrating resources on top-tier high-quality brands. Shelf e-commerce remains irreplaceable in the two scenarios of "official authentic products" and "search-driven repurchases".
Rebounding Offline Foot Traffic, Store Structure Undergoes "Quantity Reduction and Quality Improvement"
Data released by CFFCA shows that in H1 2026, offline channels achieved a 2.13% year-on-year positive growth, currently in the transition period from "passive contraction" to "active optimization".
Further research by FBeauty Future Trajectory reveals that this growth stems from the superposition of two curves.
The first curve is the significant rebound in customer foot traffic.
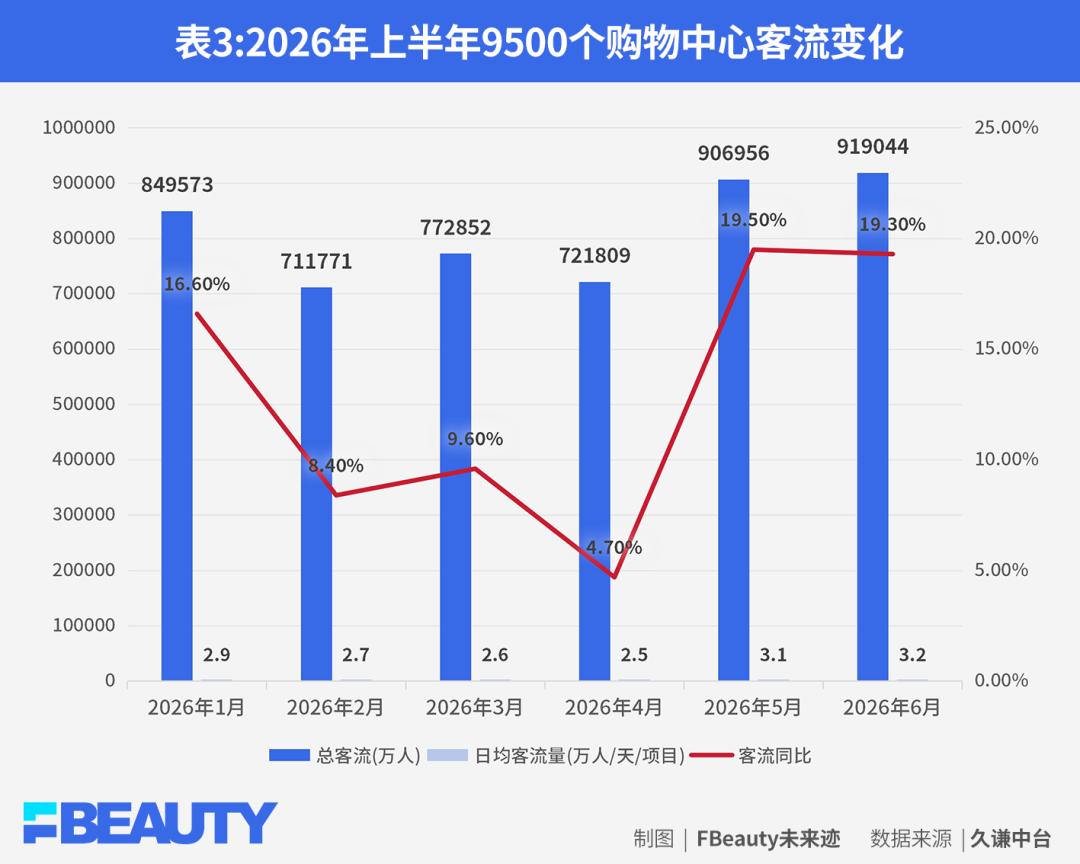
According to monitoring data from Jiuqian Mid-Platform covering approximately 9,500 large shopping malls nationwide, foot traffic across all locations recorded positive year-on-year growth from January to June 2026. The year-on-year growth rates in May and June reached 19.50% and 19.30% respectively, with the average daily foot traffic in June hitting 32,000 people per project per day.
Foot traffic is the oxygen of offline commerce. With the return of this "oxygen", beauty collection stores, brand experience stores, and department store counters located in shopping malls have all gained tangible traffic recovery — especially for high-experience categories such as color cosmetics and perfumes that "require in-person testing on the skin and on-site scent sampling".
The second curve is the continuous "quantity reduction and quality improvement" of the store structure.
First, the number of operational "specialized cosmetics stores" and "department store counters" — the main offline sales channels for cosmetics — continues to decline.
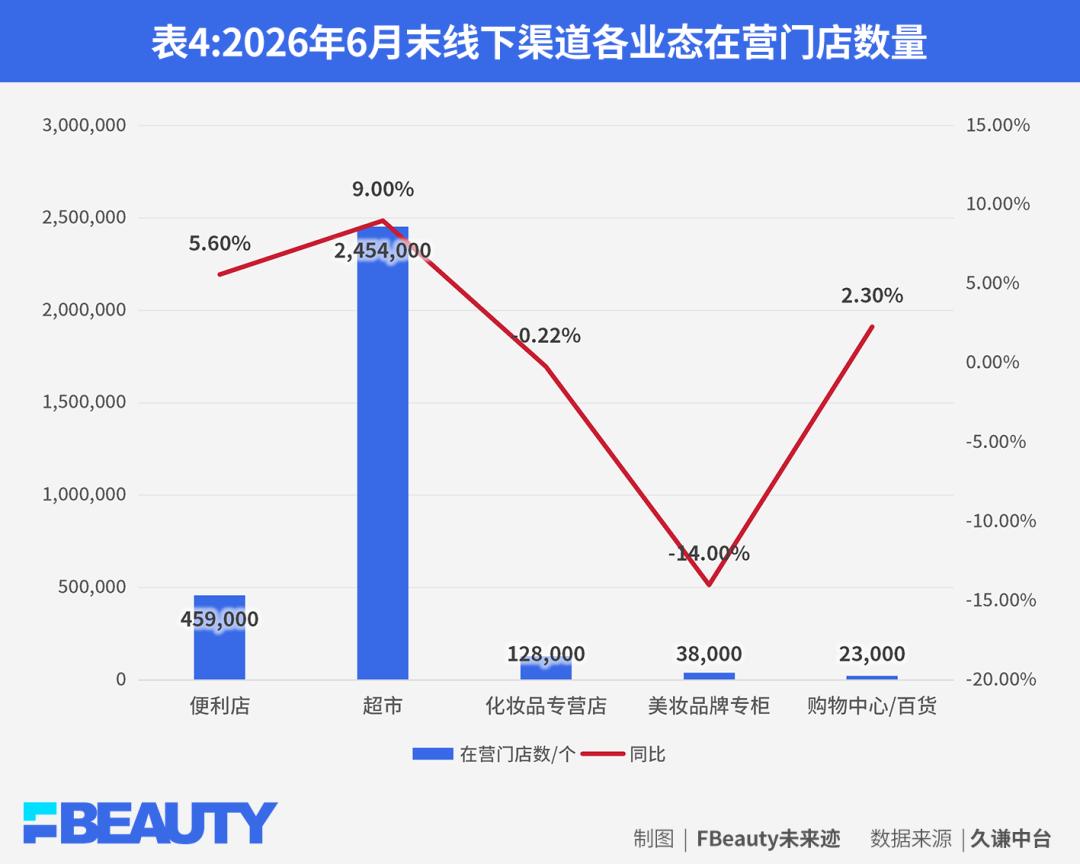
By the end of June 2026, there were approximately 38,000 operational cosmetics department store counters nationwide, marking a further 14% year-on-year decrease. This represents the 7th consecutive year of contraction since 2019, dropping from a peak of over 100,000 units to fewer than 40,000 today.
The number of operational specialized cosmetics stores is also steadily shrinking. As of the end of June, there are around 128,000 operational specialized cosmetics stores (including trendy beauty stores) nationwide, a slight 0.22% year-on-year decrease. Data shows that the total number of operational specialized cosmetics stores exceeded 220,000 before 2019.
However, supermarkets and convenience stores are rapidly expanding into lower-tier markets. By the end of June, the number of operational supermarkets nationwide reached approximately 2.454 million, up 9.00% year-on-year; convenience stores numbered around 459,000, representing a 5.60% year-on-year growth. The fastest-growing outlets are community-focused supermarkets and convenience stores such as Meiyijia. Cosmetics are not the core product category for these supermarkets and convenience stores.
It is worth noting that corresponding to the reduction in the number of operational stores is the improvement in per-store output.
Taking specialized cosmetics stores as an example, based on a sample survey of approximately 20,000 specialized cosmetics stores across the country, although the average transaction value per store fluctuated monthly in H1 2026, it showed an overall recovery trend.
Except for a 10.61% year-on-year decrease in January due to factors such as the Spring Festival date shift, the remaining five months all recorded positive year-on-year growth. The high growth rate in February was also affected by the Spring Festival date shift (the 2025 Spring Festival fell in January, and the post-holiday off-season lowered the comparison base for February 2025). If January and February are combined for calculation, the average transaction value per store saw a slight year-on-year increase. The growth rates in March and June both exceeded 5%.
This trend indicates that although the number of specialized cosmetics stores continues to shrink, the operational efficiency of remaining stores is improving by enhancing service quality and optimizing product selection structures. The improvement of per-store efficiency is a key signal for specialized cosmetics stores to seek breakthroughs in the stock market competition.
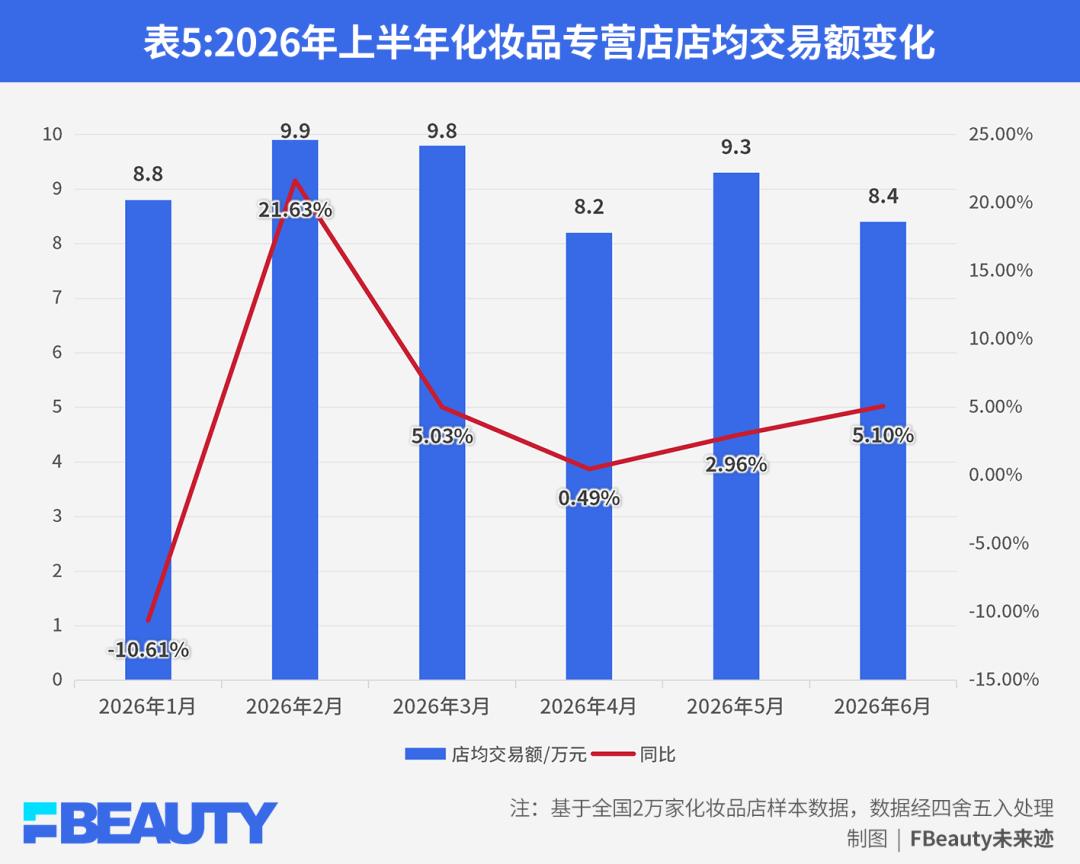
These two sets of figures together tell the same story: The offline sector is not restoring the old order, but growing a new structure. Inefficient outlets that only serve a "shelf" function are being phased out; outlets that can deliver experiences and services are capturing new traffic.
Why Is the Fundamental Skincare Product Segment Declining?
Another data point from CFFCA's announcement deserves attention. As the foundational segment that accounts for nearly half of online transaction value, the online transaction value of skincare products in H1 2026 decreased by 5.40% year-on-year, and transaction volume dropped by 3.46% — making it the only key category to record negative growth, directly dragging down the overall market growth rate.
Why is the fundamental skincare product segment declining?
Data obtained by FBeauty Future Trajectory from third-party institutions shows that in terms of subcategories, the top five skincare product subcategories with the largest transaction value declines in H1 2026 are skincare sets, lotions/creams, facial masks, aromatherapy essential oils, and eye care, with a total combined decline of 6.192 billion yuan. Among them, facial care sets and lotions/creams are the two subcategories with the largest declines, dropping by 2.25 billion yuan and 1.838 billion yuan respectively.
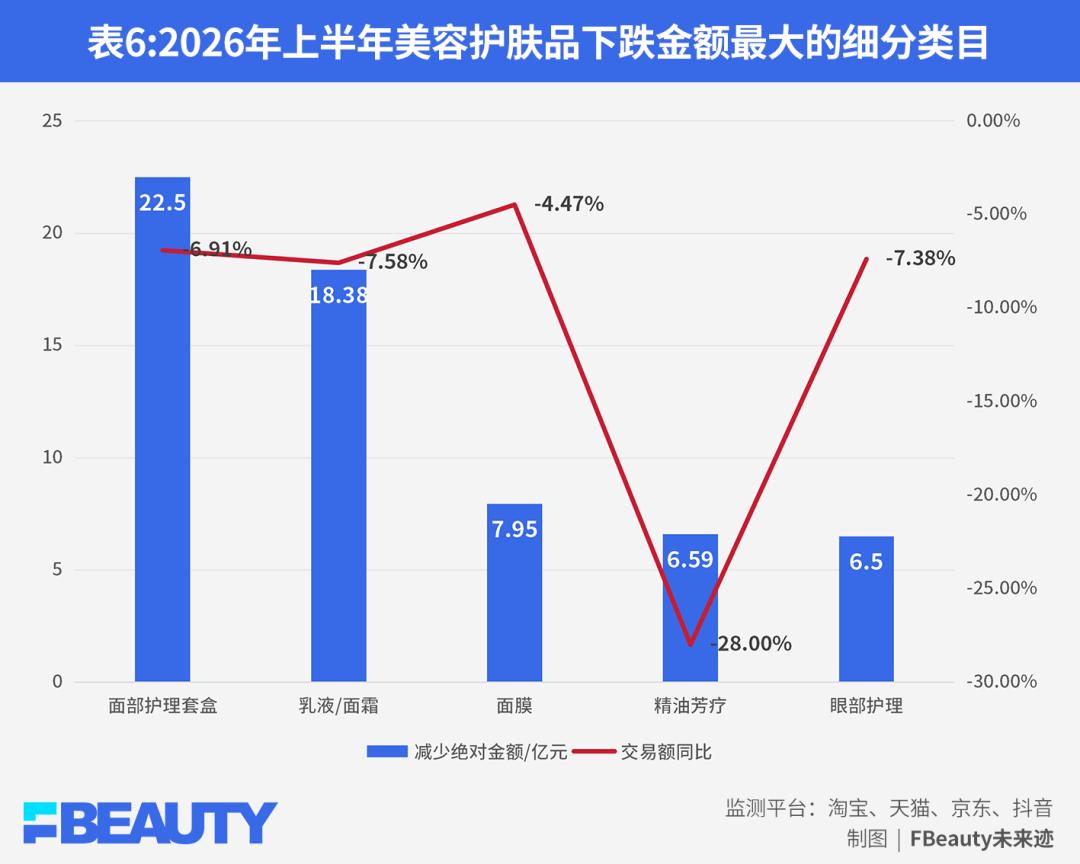
Further analysis by FBeauty Future Trajectory found that the decline of facial care sets carries a certain "black swan" characteristic.
The brand with the largest decline in facial care sets saw its transaction value drop by 1.538 billion yuan. However, the core reason for this brand's decline was the impact of a level-S negative public opinion incident at the end of 2025. As public opinion sentiment recovers, its transaction value is now fully rebounding.
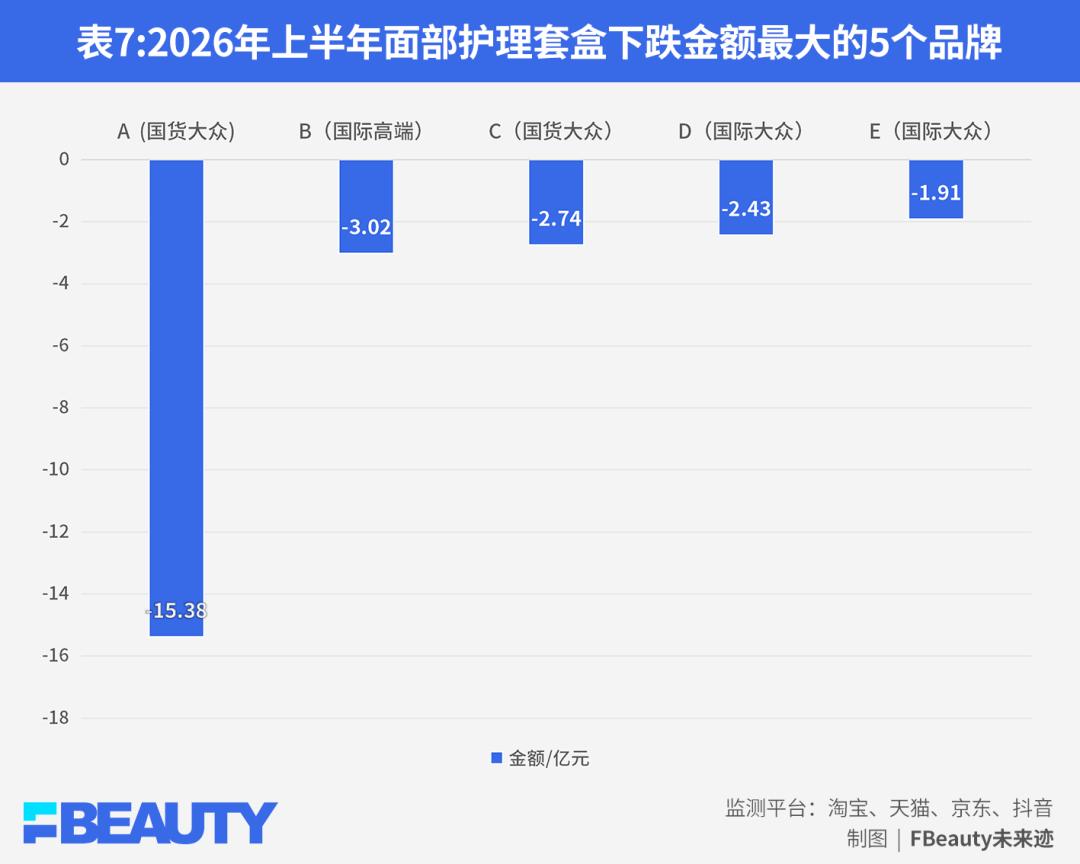
However, it should also be noted that the remaining four brands still recorded a combined decline of over 1 billion yuan. This part of lost demand is unrelated to public opinion incidents, and there remains uncertainty about whether the overall subcategory can shift from negative to positive growth in the second half of the year.
In contrast, the decline of the lotions/creams subcategory is more like a "gray rhino" event.
Data obtained by FBeauty Future Trajectory shows that the vast majority of the top five brands with the largest declines in the lotions/creams subcategory are unbranded domestic white-label products, alongside one international mass-market brand.
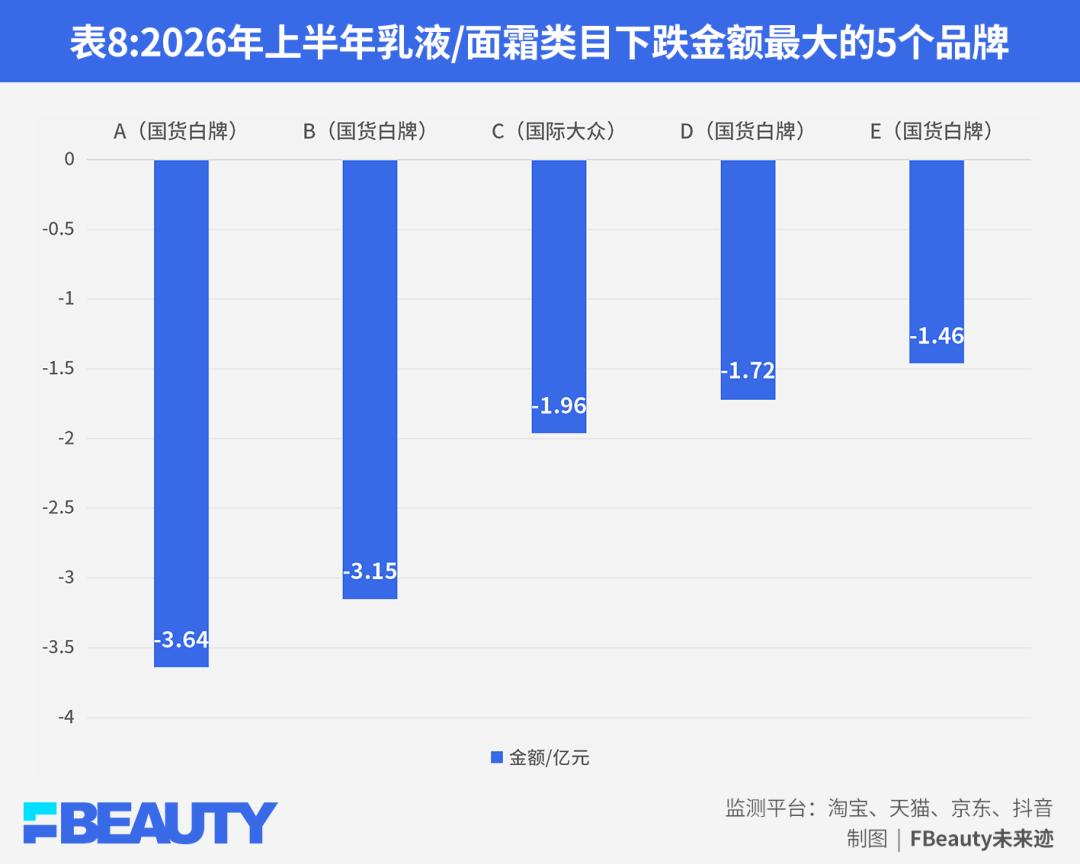
Based on the above analysis, FBeauty Future Trajectory believes that the core reason for the decline of the lotions/creams subcategory, and even the entire skincare product category, is the formation of a K-shaped pattern of "both ends rising while the middle collapses" caused by intensifying market competition — this is the "gray rhino" event that deserves the industry's highest attention.
How Was the K-Shaped Pattern of "Both Ends Expanding, the Middle Collapsing" Formed?
After analysis, FBeauty Future Trajectory believes that in H1 2026, the online skincare product market is experiencing a top-down "waterfall-style" price transmission. The price system of the entire market does not fluctuate independently across different segments, but forms a chain reaction across the three tiers of high-end, mid-range, and low-end markets.
In the first tier, the premium price band above 400 yuan shows an overall trend of "stable volume with rising price". Data from Magic Mirror Insights shows that for products in this price range, transaction value in H1 2026 increased by approximately 3.31% year-on-year, while transaction volume remained largely flat. The expansion of transaction scale is mainly driven by the increase in average transaction price.
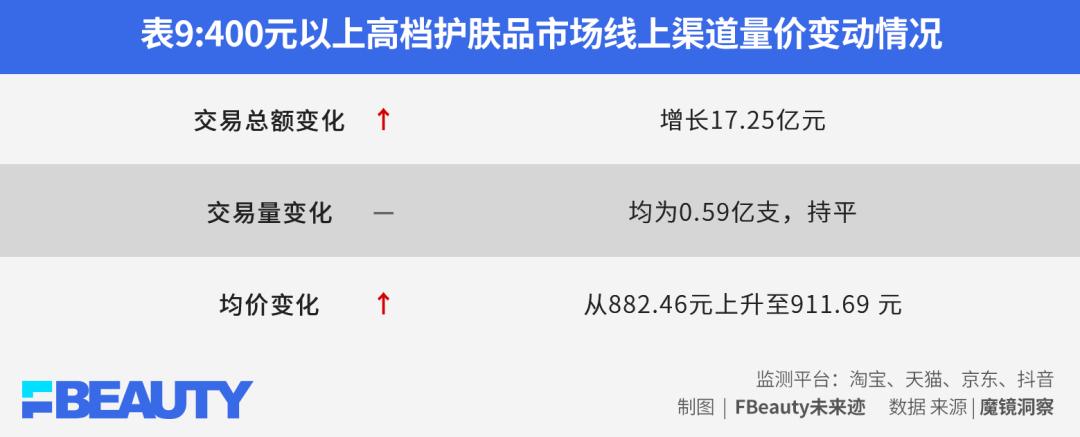
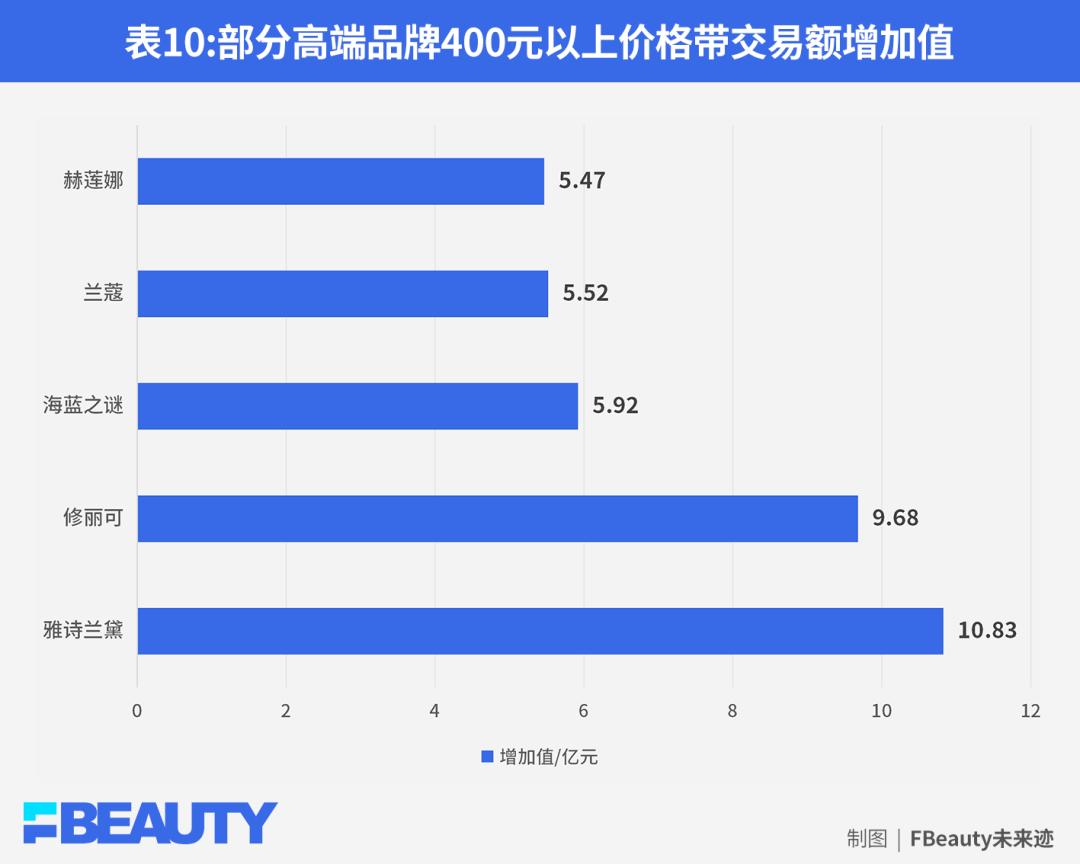
The most typical examples in this segment are international high-end brands such as Estée Lauder, SkinCeuticals, Helena Rubinstein, and La Mer. Among them, Estée Lauder saw the transaction value of its products priced above 400 yuan increase by 1.08 billion yuan year-on-year in H1 2026; SkinCeuticals recorded a 970 million yuan growth, while La Mer, Lancôme, and Helena Rubinstein all achieved growth increments of over 500 million yuan.
Demand in the high-end market is largely stable. Comparing H1 2025 and H1 2026, total transaction volume remained almost unchanged, hovering around 59 million units.
With total demand unchanged, the continuous expansion of international high-end brands' market share has led to a widespread "deflating the fluff" phenomenon spreading from top to bottom across the skincare market, as a large number of mid-range and mass-market brands' products priced above 400 yuan are comprehensively losing market presence.
Data obtained by FBeauty Future Trajectory shows that in H1 2026, the total transaction value of skincare products priced above 400 yuan from mid-range and mass-market brands decreased by approximately 6 billion yuan (sampled from the top 1000 online brands).
As this effect propagates, the second price tier of the entire market — the mid-range market priced between 100 yuan and 400 yuan — begins to contract downward.
The mid-range skincare market is currently caught between two opposing pressures: it cannot reach the trust barriers of the high-end market, nor can it resist the cost-performance advantage of low-priced alternatives. Data obtained by FBeauty Future Trajectory shows that among the top 1