Smart money in the US stock market is making bottom-fishing moves in these two areas, how to trade the earnings reports of the four big tech giants this week?
Latest live trading data from Wall Street institutions shows hedge funds are reducing positions in some tech stocks at a historically unprecedented pace.
On the surface, this appears to be a typical risk-off market move. But if you assume that smart money is completely abandoning AI and the tech sector, you may be underestimating the true intentions of institutional investors.
Because behind this market correction, capital is not simply exiting the market—it is repositioning itself in new directions.
Why are core companies in the AI industrial chain receiving different treatments? Google is facing market skepticism due to its massive AI capital expenditure, while Meta continues to gain capital favor.
Why are institutional investors reducing positions in general software stocks, while hardware companies like AMD keep landing AI ecosystem orders? Micron even saw nearly $100 million in large option transactions on Wednesday alone.
Are institutions fleeing the AI bubble, or using market volatility to reposition for the next phase of winners?
How should we interpret the earnings reports from tech giants including Meta, Microsoft, Amazon, and Apple this week? The real concern in the market is no longer whether AI has a future, but rather:
What is Wall Street selling off right now?
And what is it betting on in advance?
Today, we will break down the real choices of smart money behind this sector rotation in the market.
The Historic Decoupling of U.S. Stocks
A severe division is taking shape within the U.S. stock market.
The real issue right now is not whether the indices can keep rising.
The question is:
The forces driving the indices higher are becoming increasingly concentrated.
On the surface, U.S. stocks remain strong, but a clear rift has emerged beneath the market surface.
We can observe this shift through three sets of data.
First, individual stock performance is decoupling from the broader market.
Data shows that among the 1,000 largest U.S. companies by market capitalization, the number of stocks moving "in the opposite direction" of the S&P 500 (i.e., with negative beta) has suddenly surged to 108, significantly higher than normal levels over the past decade.
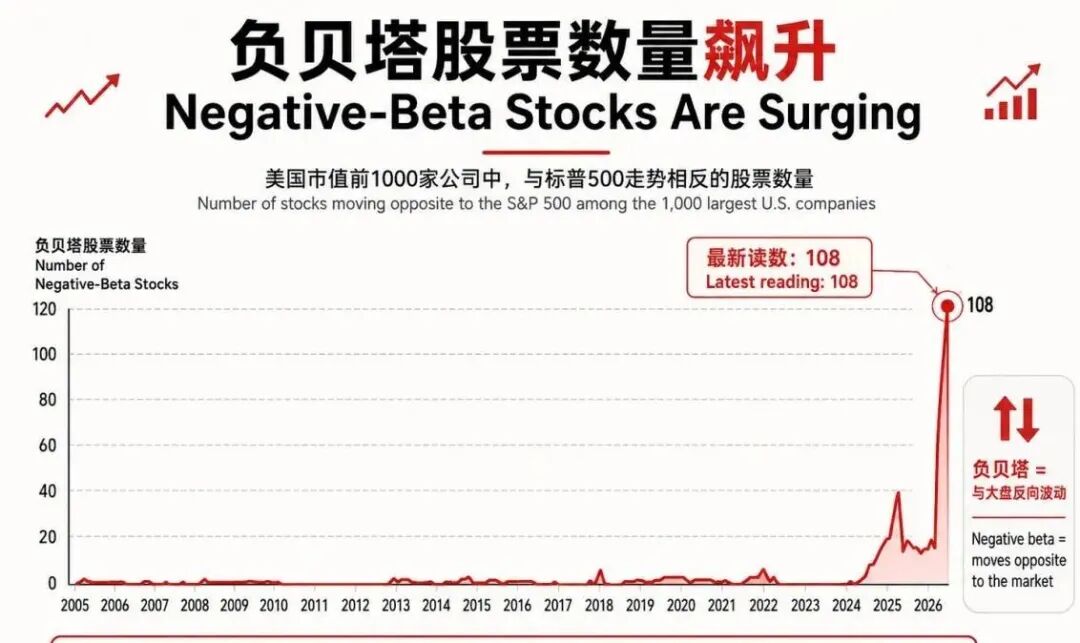
This means that in the past, most stocks typically fluctuated in line with the broader market direction. But now, an increasing number of companies are diverging from the indices.
The market is no longer a scenario where "all companies rise together." Instead, a small number of stocks keep climbing while more companies gradually fall behind.
Second, the divergence within the indices is widening.
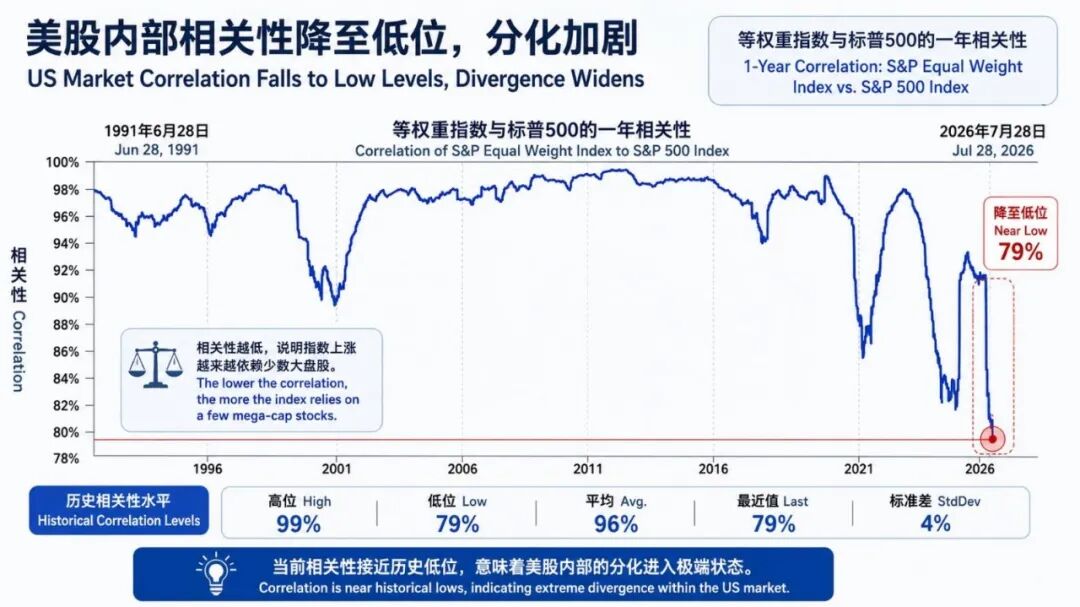
Goldman Sachs data shows that the one-year correlation between the equal-weighted S&P 500 and the traditional market-cap-weighted S&P 500 has dropped to 79%, far below the long-term average of 96%.
In simple terms:
The traditional S&P 500 index is heavily influenced by super-weighted stocks like Apple, Microsoft, and NVIDIA;
While the equal-weighted index represents the true performance of more ordinary companies.
As their trends increasingly diverge, it points to one phenomenon:
What's driving the market higher is not the entire market, but a small subset of core assets.
Third, the most capital-intensive semiconductor sector is seeing significantly amplified volatility.
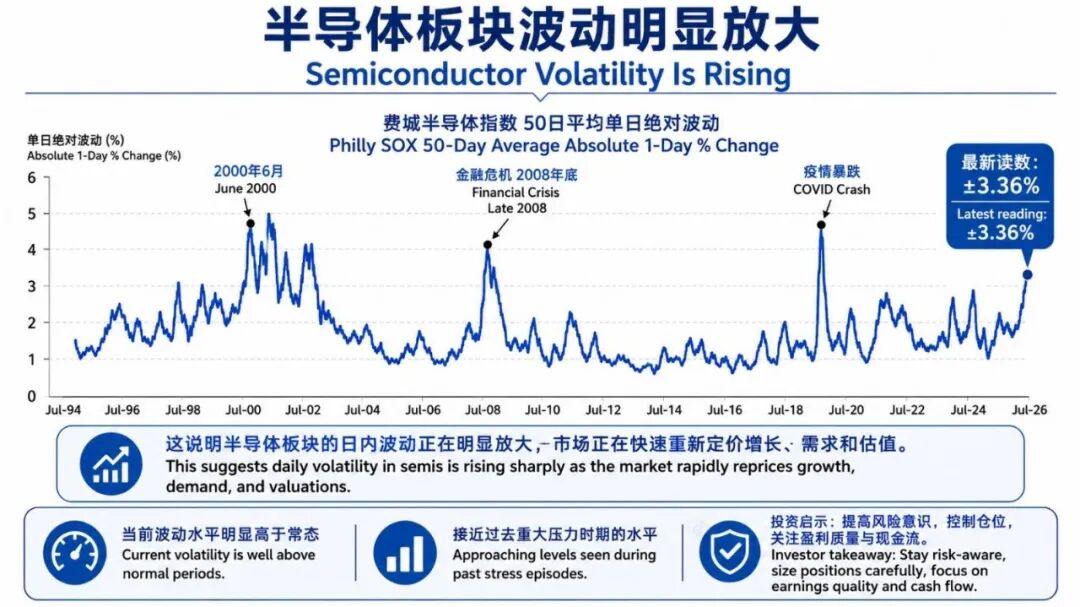
Over the past 50 trading days, the semiconductor sector has recorded an average daily swing of 3.36%.
This level indicates the market is rapidly reprising the industry's future growth, demand, and valuation.
When we combine these three sets of data, what we see is not "the U.S. stock market is about to crash."
Instead:
The current market is increasingly dependent on a small number of core assets, with shrinking internal buffer space.
As long as the growth expectations for these leading companies remain unchanged, the indices can maintain their strength. But once the market starts to reassess their growth prospects, volatility could be amplified rapidly.
The recent wild swings in Korean memory stocks serve as a typical case. When capital is highly concentrated in a hot track, even without fundamental changes to the industry logic, a short-term shift in expectations is enough to trigger sharp price fluctuations.
Therefore, in the face of the recent sharp volatility in the chip sector, following conventional wisdom, many investors' first reaction is to reduce risk and cut positions.
But what's truly worth noting is:
While the market is growing concerned about risks, the latest Goldman Sachs-disclosed hedge fund trading data shows that smart money has not chosen a simple retreat. On the contrary, a more refined, targeted reallocation of capital is quietly taking place.
The Truth Behind Smart Money's Position Adjustments
Looking at this Goldman Sachs chart, the area circled in red shows that over the past 8 weeks through July 16, the net capital flow of hedge funds in the entire U.S. information technology sector has plunged to an extreme low near -10%.
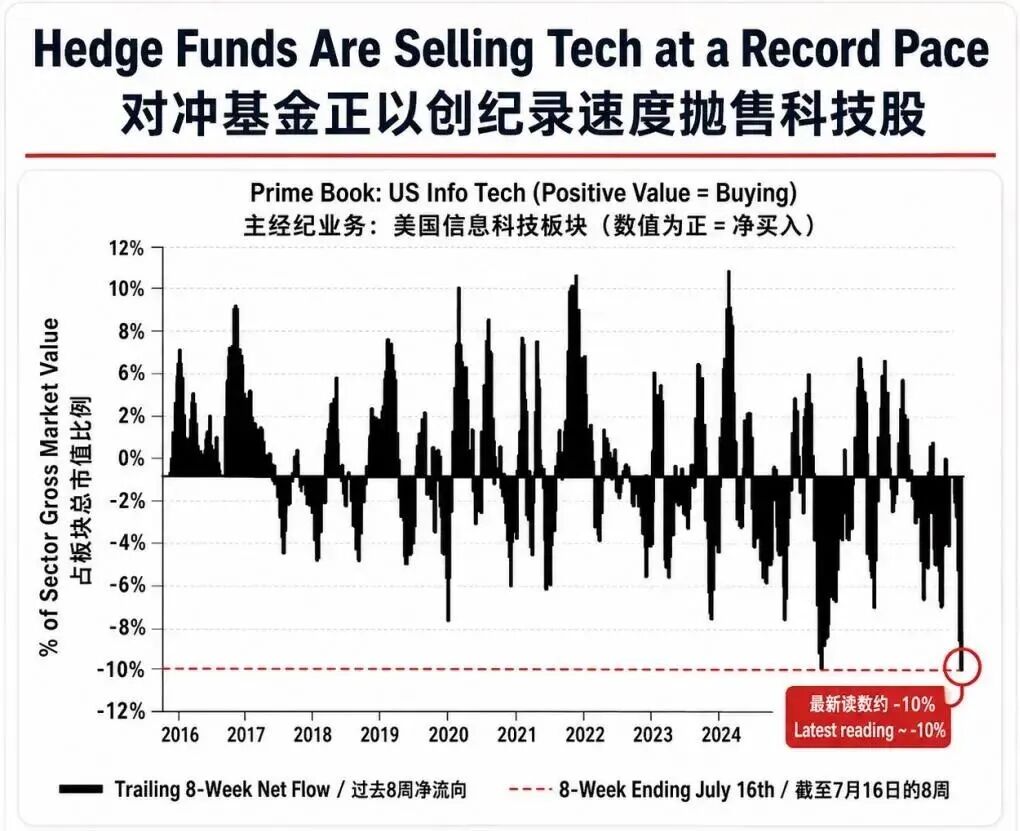
But here's a detail that many people find confusing — "Information Technology" is a broad category, semiconductors are just one part of it, with the rest mainly consisting of software companies and consumer electronics hardware. Without breaking it down, it's easy to mistakenly assume that "semiconductors have been abandoned."

So to figure out where the money is actually going, we need to examine the three separate Goldman Sachs charts on semiconductor sub-sector positions one by one:
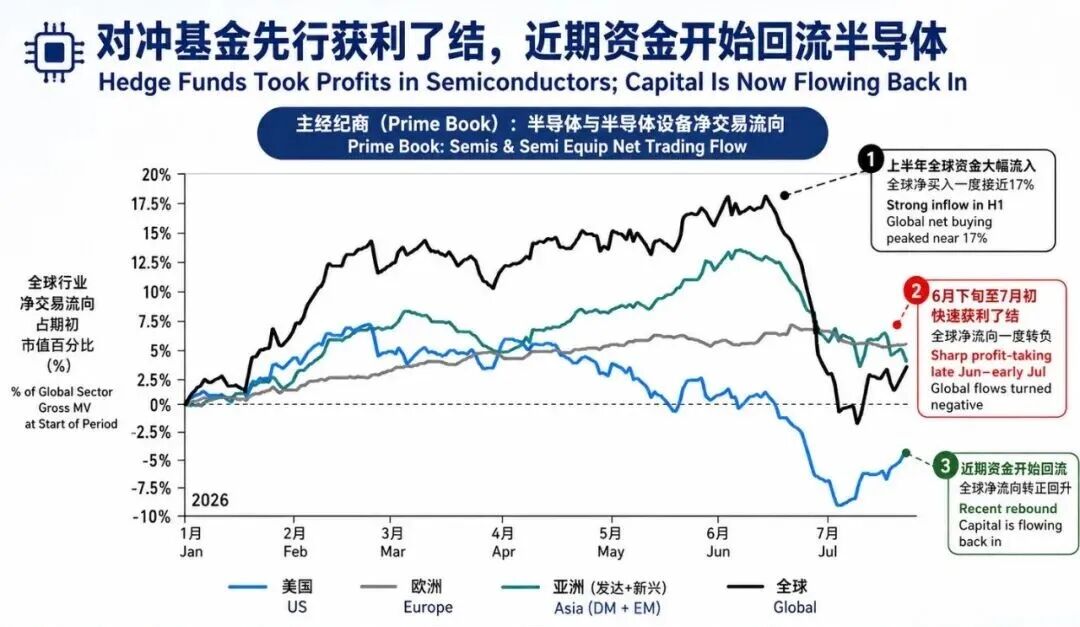
The first chart shows the net buying and selling flow of global hedge funds in semiconductors.
Since mid-June, they have indeed been aggressively taking profits, unwinding nearly 80% of the cumulative positions they built in the first half of the year. But notice the far right of the curve — the line has clearly turned upward recently, indicating that large funds have resumed net buying.
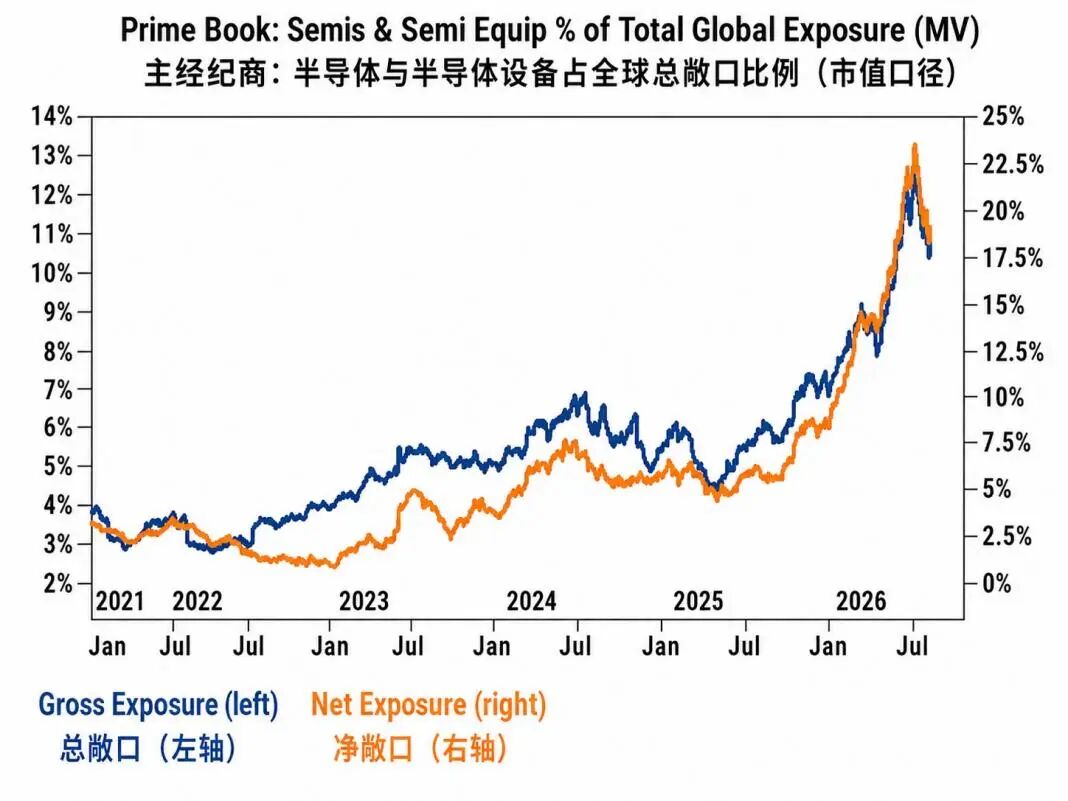
Then why did semiconductors correct so sharply earlier? The next two charts reveal the reason: The level of position crowding once reached an extreme limit.
One chart shows that in June, global semiconductor exposure as a percentage of total hedge fund positions once surged to an all-time high of 24%.
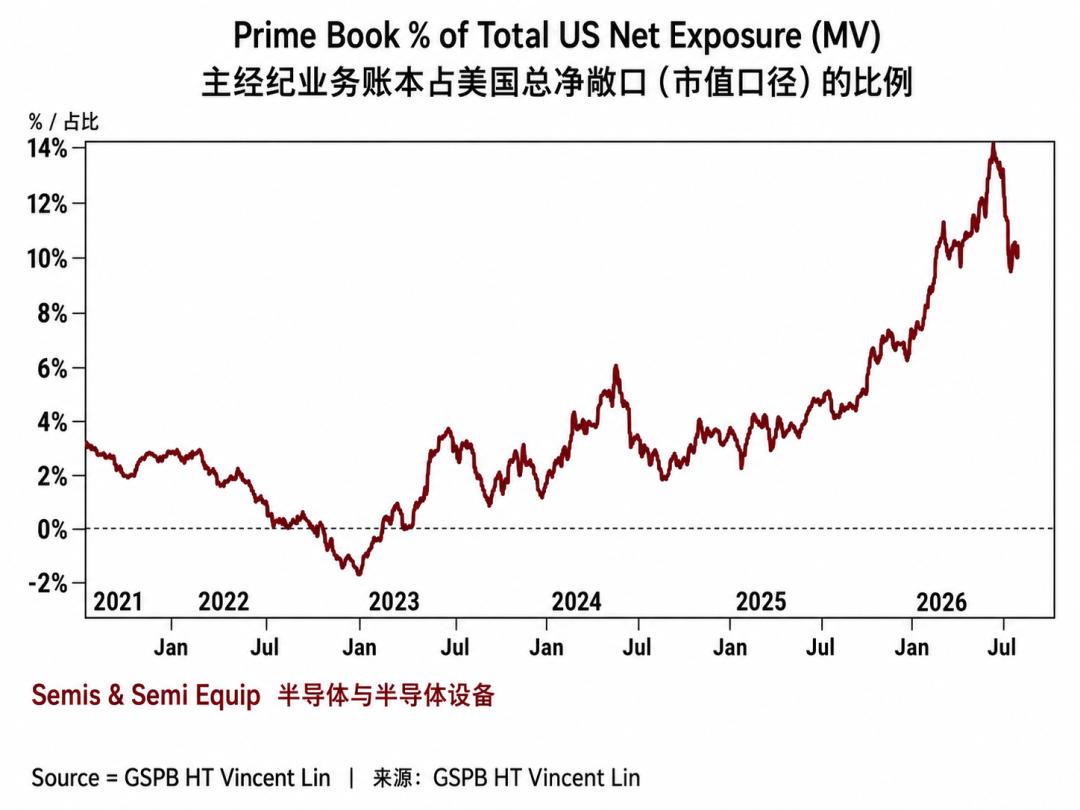
The other chart shows that U.S. semiconductor allocation also hit 14%.
With positions so full and capital so concentrated, the market naturally becomes extremely sensitive to any news, and even a single piece of information can trigger a chain sell-off.
Putting all this data together, the true strategy of Smart Money becomes clear.
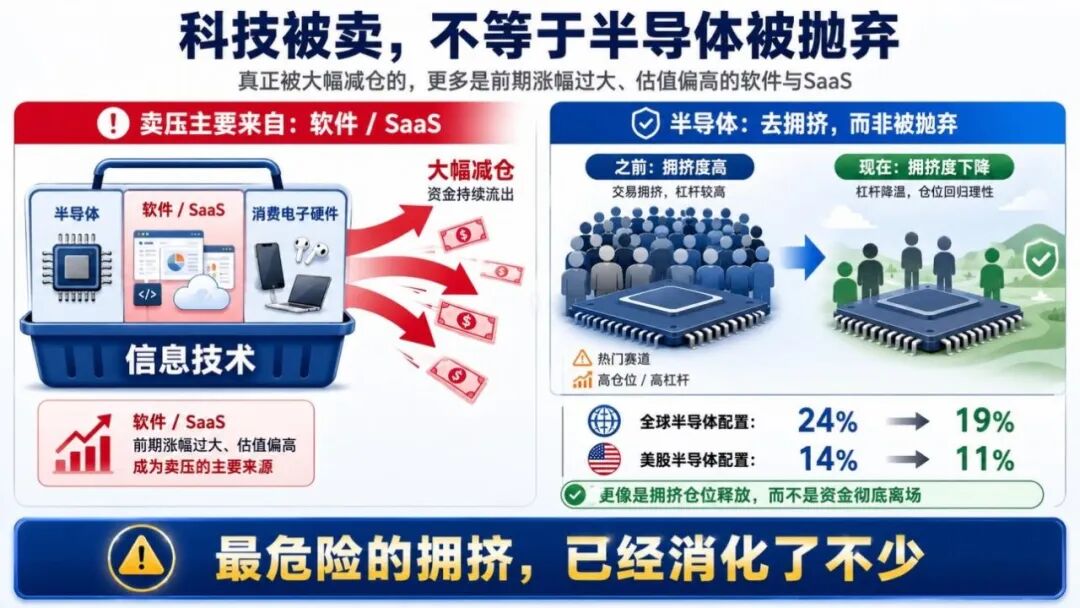
The extreme net selling in the information technology sector was not primarily driven by semiconductors, but concentrated more on software and SaaS stocks that had seen excessive gains and overvalued valuations in the early period.
Semiconductors did experience significant profit taking, but that was more like a concentrated deleveraging after positions became overly crowded. As global semiconductor allocation fell from 24% to 19%, and U.S. semiconductor allocation dropped from 14% to 11%, the previously dangerous crowded state has been largely relieved.
More critically, the net buying/selling curve for semiconductors has recently turned upward, indicating that large funds have not completely abandoned the chip industrial chain, but are seeking new opportunities after the shakeout of positions.
From a sub-sector perspective, capital focus is starting to shift toward two higher-elasticity areas:
One is upstream semiconductor equipment, including ASML, Applied Materials (AMAT), and Lam Research (LRCX);
The other is the memory industrial chain with stronger cyclical elasticity, including Micron (MU), Western Digital (WDC), and Seagate (STX).
U.S. Stock Big Data: MU Options
If you think Goldman Sachs' position data has a certain lag, let's look at a set of more timely live trading signals. Between the two tracks of semiconductor equipment and memory, memory chips have clearly seen the most intensive capital moves recently.
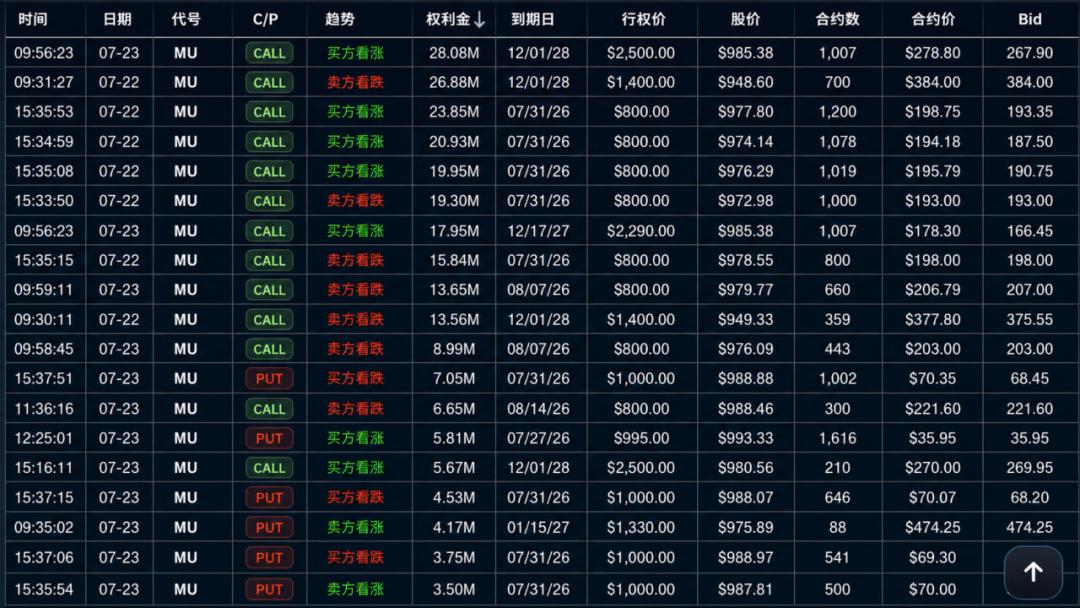
According to the real-time option anomaly order flow from U.S. Stock Big Data StockWe.com, Micron has recorded rare large option transactions for two consecutive days.
Let's start with the late trading session last Wednesday, July 22.
Between 15:33 and 15:35, in just 3 minutes, the market executed five consecutive deep-in-the-money CALL options expiring on July 31 with a strike price of $800.
Three of these trades were buyer-dominated, with total premiums amounting to $64.73 million;
The other two were seller-dominated, totaling $35.14 million.
In other words, the same short-term option saw cumulative trading volume of nearly $100 million within 3 minutes.
This set of highly concentrated buy and sell orders is more like large funds rapidly adjusting their upside exposure: using deep-in-the-money CALLs to achieve sensitivity close to the underlying stock, while using sell orders to recycle capital and reduce overall costs.
More notably, these contracts had only about one week left until expiration.
Large funds choosing to concentrate nearly $100 million in trading at this point indicates that the window around July 31 has become a key gaming period. This week's tech giants' earnings report guidance on AI capital expenditure and hardware demand will directly impact Micron and the entire memory sector.
(Source: StockWe.com )
By last Thursday, July 23, capital divergence widened further.
That day saw ultra-long-dated large CALL transactions of $28.08 million and $17.95 million, along with multiple PUTs at the $1,000 strike price, with the larger ones reaching $7.05 million, $4.53 million, and $3.75 million.
Therefore, the core signal revealed by these two days of orders is very clear:
Nearly $100 million in short-term in-the-money CALLs last Wednesday locked the focus of capital trading on this week;
The simultaneous appearance of long-dated CALLs and large PUTs on Thursday reflects that institutions still hold expectations for long-term trends, but have clearly become more vigilant about short-term volatility.
Smart money is not simply betting on a rise or fall, but controlling downside risks in advance while retaining upside potential. This also confirms the capital game seen in Goldman Sachs' data: institutions are reducing positions in some high-valuation tech assets, but have not left semiconductors — instead, they are repositioning for higher-elasticity opportunities after the position shakeout.
How to Interpret This Week's Earnings Reports?
Of course, Micron's option anomalies are not isolated events.
Google's earnings report released last week has already exposed the core contradiction in the current market:
AI demand remains very strong, but Wall Street's tolerance for massive capital expenditure is rapidly declining.
Google's Q2 revenue reached $119.8 billion, with cloud business revenue of $24.8 billion, up 82% year-on-year — indicating that enterprise demand for AI infrastructure and cloud computing power has not weakened.
However, Google's quarterly capital expenditure also rose to $44.