Putting Google "on Trial": Is the Market Fickle, or Is Aggressive Investment Guilty?
Looking at Google's Q2 earnings report this year, its overall performance was actually not that bad. Especially the growth rate of cloud revenue and the continued healthy expansion of backlog, which are key metrics proving that AI investments are well-placed.
However, this earnings scenario, nearly identical to that of Q1, has drawn a completely different market reaction — a 7% post-earnings share price drop. This happened even after the stock had already corrected earlier, weighed down by repeated delays in the Gemini 3.5 Pro launch that dampened bullish sentiment.
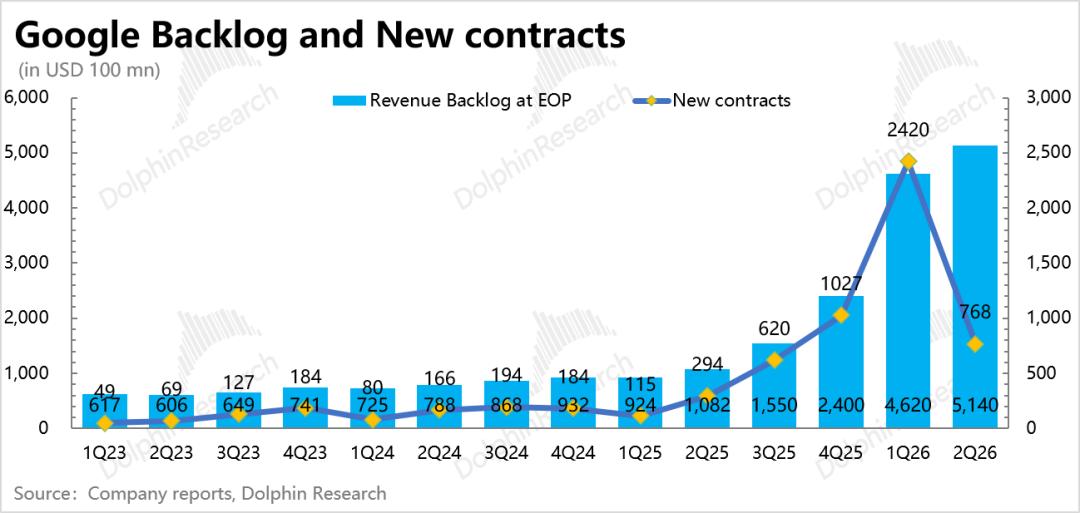
Uncertainty over the return on AI investments is undoubtedly the root cause of the market's negative feedback. While the backlog exceeded expectations by surpassing $500 billion, Google's post-earnings announcement of over $800 billion in future spending commitments instead sparked widespread market debate.
So how should we view the management's still optimistic outlook for next year's Capex? With strong performance on one side and collapsing cash flow on the other, amid Google's conflicting narratives, should we keep the faith or stand by as observers? In this article, Dolphin will discuss these questions in depth.
Below is the detailed analysis
01 Wild Spending? It's Actually "Catching Up on Homework"
On the earnings call, Google management did not provide quantitative guidance for next year's Capex as usual, but their qualitative statement remained consistent with the tone of the past two years — the original quote "We continue to expect our CapEx to increase significantly in 2027".
After earnings, the buy-side market's expectations for Google's capital expenditure next year have risen to over $3.5 trillion, implying a growth rate of >75%. If based on the market's expected 22% revenue growth next year, Google's Capex as a share of revenue would approach 60%, meaning it will not only use up all its current operating cash flow, but also need to draw on additional cash reserves or raise extra financing.
Considering that Google just raised $85 billion in equity financing at the start of the year for cash replenishment (for details, see "Google Borrows Another $800 Billion From the Sky"), if subsequent share repurchases are redirected to fund capital expenditures and no excess cash is retained, theoretically it can support spending for this year and next. But this level of "wild" spending is still rare for the traditionally "steady" Google.
Conversely, it can also be said that Google was slow to ramp up investments. While Microsoft, Meta, and Amazon began rapidly increasing their Capex-to-revenue ratios in early 2024, Google kept this ratio almost flat throughout the year without major changes. It was not until 2025 that Google's Capex truly began to accelerate.
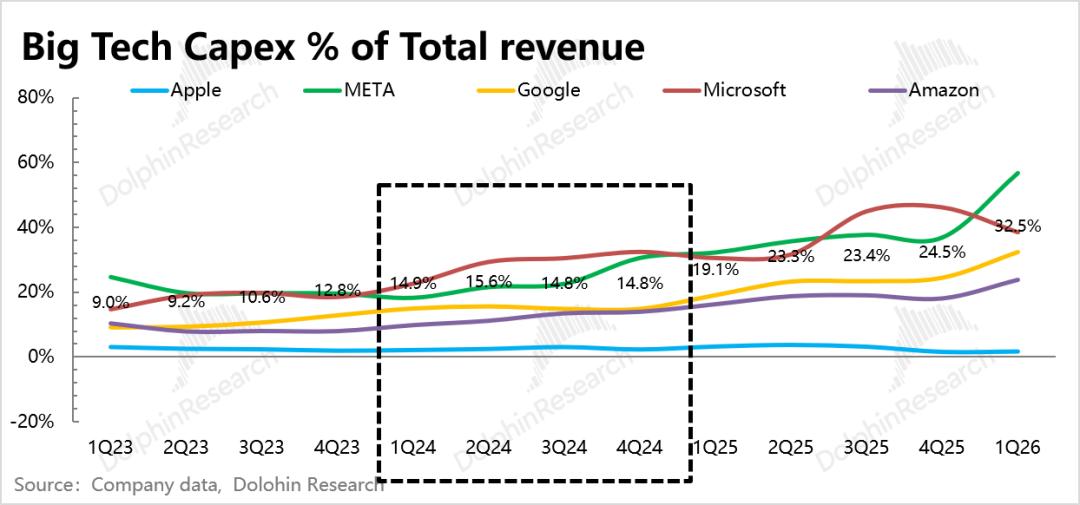
There is typically a 1-2 year cycle between the initial investment and full deployment of resources. Therefore, before 2026, Google's computing power deployment, whether in stock or incremental terms, was not leading among major cloud vendors.
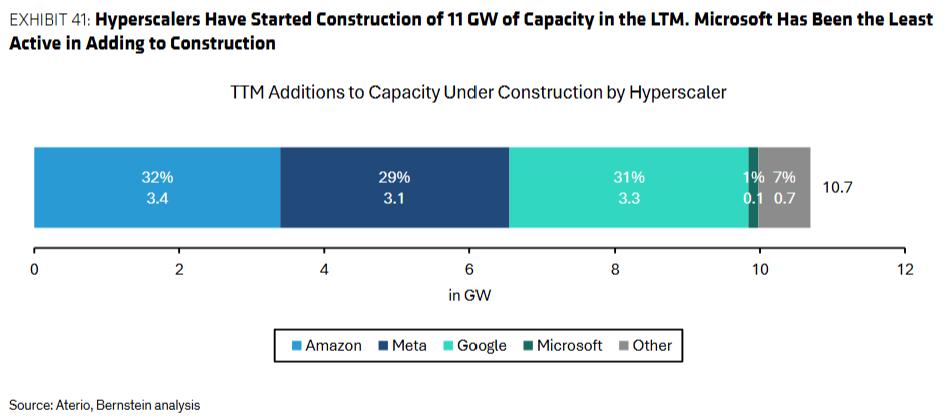
According to the changing trend of "construction in progress", Google did not see obvious new capacity planning until the end of 2025. Per Aterio's tracking, from June last year to June this year, Google's capacity under construction accounted for 31% of the total among leading cloud vendors.
Compared with peers, Amazon and Meta are still leading in the enthusiasm for capacity investment, while Microsoft has chosen a more conservative approach.
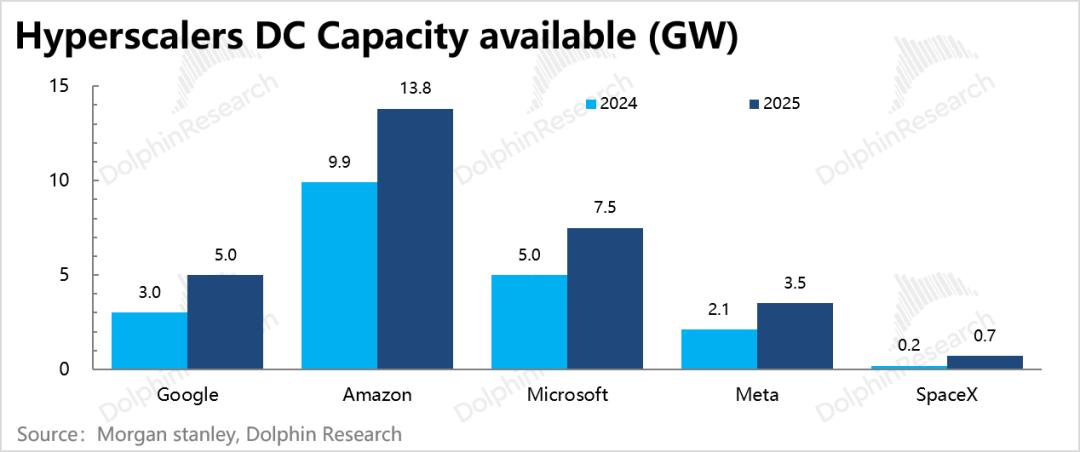
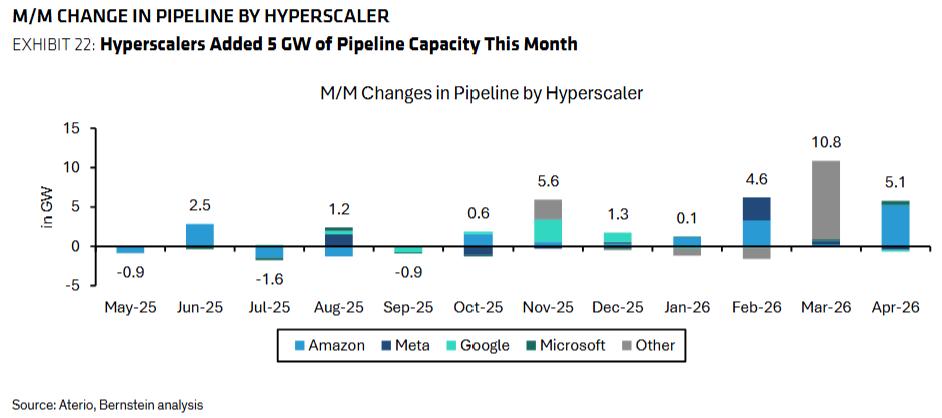
Google's supply-demand gap problem will remain severe in the first half of 2026:
On one hand, demand is exploding at an accelerating pace. At the end of last year, Gemini 3 and the significantly improved TPU v7 were released, and since the start of this year, the launches of OpenClaw, Skills, and Claude Opus 4.6 have further boosted market momentum.
On the other hand, capacity supply is still constrained by the physical limits of construction. It was not until the first half of this year that the proportion of Google's construction in progress relative to equipment assets quickly rose from the stable 30% level of last year to 38%.
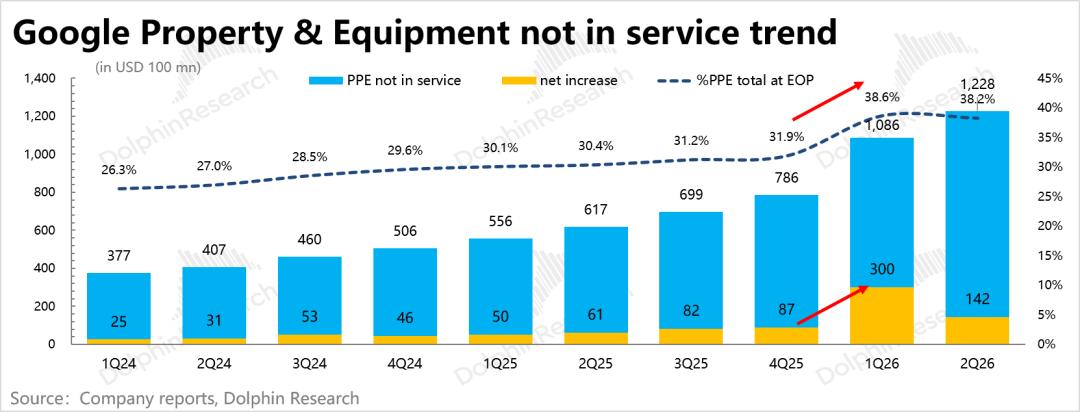
The net increase in construction in progress in Q2 reached $30 billion, while the total Capex investment in the same period was only $35.7 billion. This suggests Google may have accelerated the construction of new data centers, but it will still take at least one year from the start of construction to full deployment of this new capacity.
This demand surge driven by software innovation, combined with hardware capacity constraints caused by physical construction, will amplify the short-term supply-demand gap, leading to simultaneous spikes in real-time computing power prices and deployment costs — short-term rental prices for xAI are 3-4 times higher than long-term contract prices, and CoreWeave's computing power costs have risen from $30 billion/GW to $35 billion/GW.
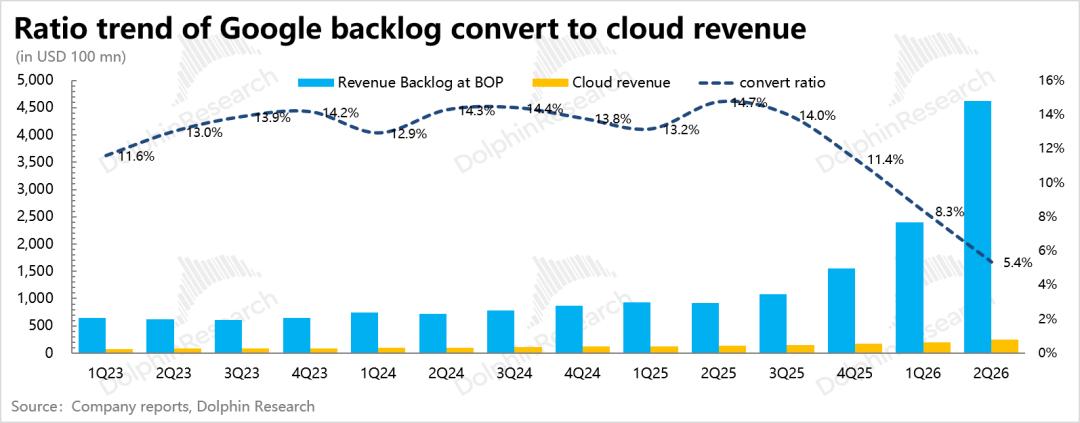
On the earnings call, management repeatedly emphasized that capacity cannot meet demand. We observed that the conversion rate between current revenue and the previous quarter's backlog has been continuously declining.
Therefore, Google management stated that they will later consider outsourcing some orders to third-party platforms, which will impact the future profit margin performance of the cloud business.
02 Not Blind Spending, But Order-Driven
This year's Capex will most likely reach the upper limit of the guidance range, just over $200 billion, which is broadly in line with market expectations. However, for next year's Capex, since the company has not provided quantitative guidance, market participants hold widely varying expectations, ranging from under $300 billion to $400 billion, representing a growth rate of 50% to 100%.
Dolphin believes that Google's management is clearly inclined to be aggressive on spending, with their main confidence coming from the $514 billion in unfulfilled backlog orders and new order volumes that have multiplied year-over-year. In management's own words, they decided to invest heavily only after seeing attractive return rates.
Therefore, we simulate the management's perspective, judging next year's Capex scale from two dimensions: the new computing power capacity required by orders, and the need to maintain a stable ROI range.
Orders → Required Computing Power Capacity → Capex
This is a relatively mainstream estimation method in the market: calculate the incremental Capex needed based on the computing power capacity required by current on-hand orders, then add the company's maintenance Capex (which currently accounts for a small proportion and changes slowly) to arrive at the total required Capex scale.
We will not expand on this here and simplify the calculation process:
(1) To fulfill $257 billion in order demand over the next 2 years (50% of the backlog is due within 24 months), based on a short-to-medium term rental price of $15 billion/GW per year, a total of 17GW of capacity is required.
(2) Considering the 1-2 year deployment cycle, to meet the demand in 2027 and 2028, we need to calculate how much new capacity needs to be commissioned in 2027 after deducting the new computing power added in 2025 and 2026.
Combining estimates from investment banks and consulting firms, the total new capacity added in 2025 and 2026 will be nearly 8GW, so an additional 17-8=9GW of capacity needs to be built in 2027. At a cost of $35 billion/GW (due to price increases for storage and other module materials, the original $30 billion/GW deployment cost has risen to $35 billion/GW), the total required investment will be $315 billion.
Adding the more than $50 billion in regular maintenance Capex (calculated at a 25% growth rate), the total reaches $365 billion.
Past ROI → Estimated Future New Orders → Capex
From the perspective of return on investment, how should we judge the current pace of investment? After all, at this stage, due to the non-linear nature of AI development, no one can accurately calculate the ROI between current investments and future returns.
Dolphin recalls an example management used on the earnings call to illustrate the supply shortage — even though the company has expanded its investment exposure over the past three years compared to previous years, the supply-demand gap remains large.
This shows that when judging the pace of investment, management tends to look back at the same period in history to compare the ratio between "investment amount" and "order amount".
After reviewing historical data, we found that over a 12-month cycle, the proportion of Capex in new orders within the same period mostly falls in the 65%-85% range, which we regard as an ROI control indicator to grasp the pace of investment based on demand visibility.
However, since the second half of 2025, after the order growth rate began to "surge out of control", Capex investment failed to keep up in time, causing the ratio between the two to rapidly drop to below 30%.
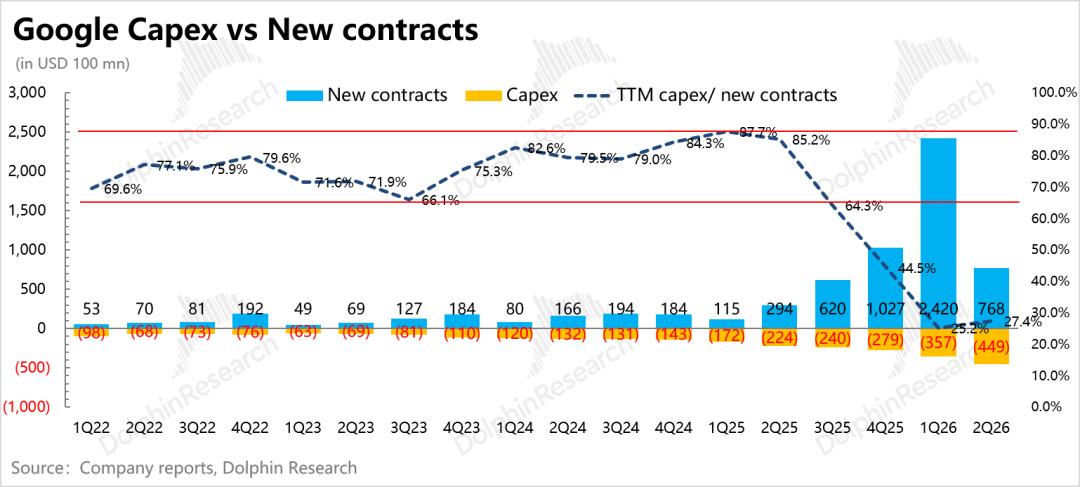
Therefore, even if no new orders come in later, Google still needs to fill this investment gap accumulated over more than half a year (at a 70% ratio, Dolphin estimates it at about $206 billion). However, with the mass production of TPU 8i/8t in 2028, there should be no shortage of pre-placed new orders, to say the least.
Even if we estimate based on a quarterly new order demand of $50 billion (considering that 2026 will include special long-term agreements from Anthropic and other parties, the mass production and shipment of the 8th generation TPU next year, and the extreme imbalance between supply and demand this year which is an abnormal state, we use the 2025 average quarterly new order volume of $51.4 billion for estimation), the annual new order volume will reach $200 billion. At an investment-to-order ratio of 65%-85%, this corresponds to $130-170 billion in new investment.
Adding the previously mentioned roughly $200 billion investment gap, the total required investment for 2027 will be $330-370 billion.
Combining the two estimation approaches, from the demand (order) perspective, Capex will basically fall in the $300-400 billion range, which is broadly in line with market expectations, indicating that most market participants also estimate the required capital expenditure from the demand side.
03 Asymmetric Risks: $500 Billion in Orders vs. $800 Billion in Commitments
According to the above estimates, the $350 billion investment is largely based on the $514 billion backlog. If these orders are fulfilled on schedule and more than 50% of the revenue can be recognized within 24 months, then Google's heavy spending will be well-justified.
As a powerful company, Google should have a relatively mature and rigorous system for forecasting order conversion and tracking customer demand. Therefore, the confidence level of its commitment that "50% of the total order amount will be converted into recognized revenue within 24 months" is normally relatively high.
But risks still exist. Through comparison, Dolphin found that the fulfillment quality of Google's backlog may still lag behind Micron's long-term agreements.
Corresponding to this is the output side — the $800 billion external spending commitment and the credit endorsement with SPVs. In essence, Google is locking in capacity and prices with suppliers for its future investment and operating expenses (chips, data centers, power, content licensing, etc.) in advance, while using its AAA credit rating to assume a potential penalty payment off-balance sheet in the future.
In other words, if the computing power capacity gap remains tight and upstream raw material prices stay high, Google's move is relatively advantageous. Conversely, if there is an oversupply of computing power, Google will face dual pressure — the backlog may not be fully fulfilled, but the procurement has already taken place, and the committed penalties still need to be paid.
Therefore, the key risk judgment lies in which side has stronger binding force: the revenue orders on one side, or the procurement contracts on the other? For Google, which side does its risk exposure lean more towards?
Backlog: Binding, But Not Strongly
Micron's long-term agreements have several key binding constraints : specified deadlines, limited price ranges, and cash deposits, etc.
The limited price range prevents the situation of "forced underpricing", where the contract amount remains unchanged but the delivery volume has to increase due to changes in industry supply and demand.
The $22 billion deposit accounts for 22% of the cumulative receivables under the contract's minimum price. This advance payment is equivalent to Micron using part of its customers' money to expand production, indirectly reducing its own heavy-asset burden.
In comparison, Google's back