"Sell", Goldman Sachs and Bank of America have issued warnings one after another, while some investors are increasing their positions.
The U.S. stock market is currently exhibiting a rare position divergence pattern: sentiment indicators at the institutional level have flashed sell signals for three consecutive weeks, while hedge funds and options traders are simultaneously increasing their positions, with a particular focus on tech stocks. The coexistence of bullish and bearish signals makes the market trajectory increasingly difficult to assess.
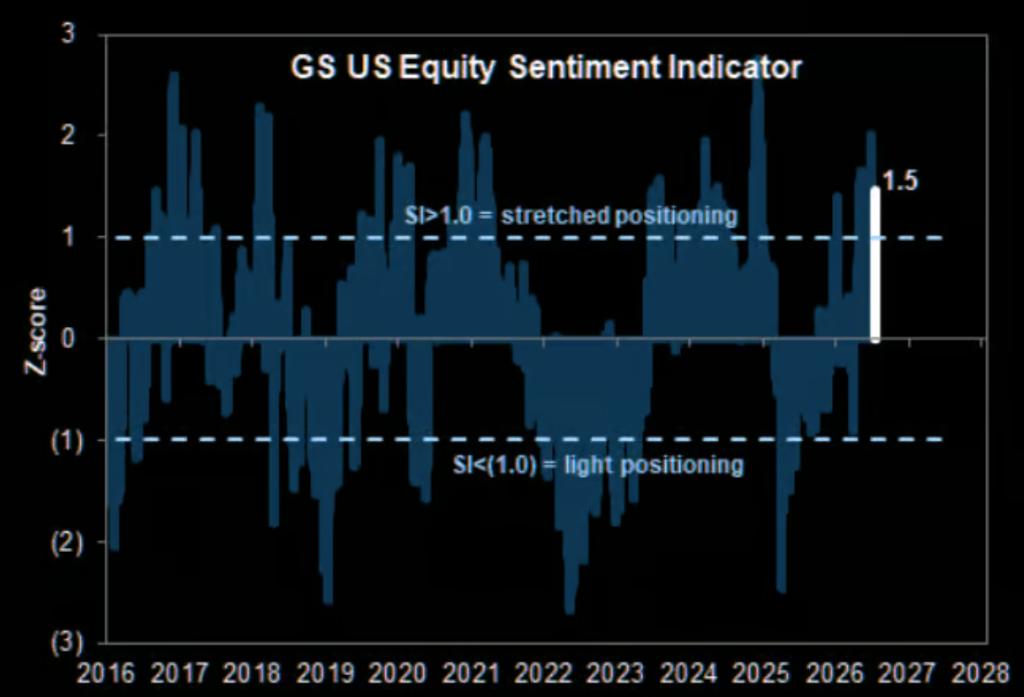
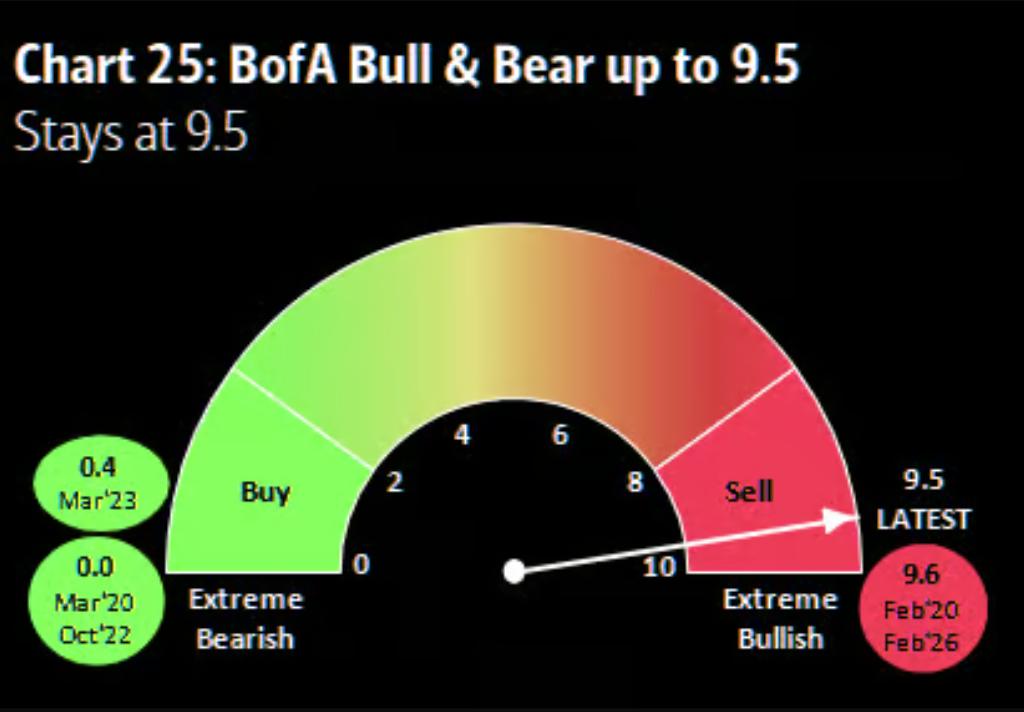
Goldman Sachs' sentiment indicator has remained in the "overstretched" sell zone for the third consecutive week, and Bank of America's Bull & Bear Indicator has also hit an extreme reading of 9.5, with analyst Michael Hartnett explicitly issuing a sell signal. The simultaneous warnings from the two major institutions have resonated, casting a shadow over the current market optimism.
At the same time, hedge funds made their first net purchase of U.S. stocks in four weeks, with the information technology sector attracting the largest capital inflows, especially semiconductor stocks. Bullish sentiment in the options market has risen to its highest level since December 2020, and the put/call ratio has plummeted to 0.61. The drastically different actions of these two types of investors have created a contradictory overall position landscape.
Goldman Sachs and BofA Simultaneously Issue Sell Signals
Position metrics from two major Wall Street institutions point to the same direction — market sentiment has overheated.
Goldman Sachs' composite sentiment indicator integrates nine position metrics across institutions, retail investors, and overseas investors, which historically has statistically significant predictive power for the near-term returns of the S&P 500 Index. The indicator has now fallen into the "overstretched" sell zone for the third consecutive week.
Over at Bank of America, strategist Hartnett stated that the bank's Bull & Bear Indicator currently reads 9.5, which has triggered a clear sell signal, and this strong sell signal continues to hold. This indicator is generally regarded as a contrarian reference for market sentiment, where a higher reading indicates a more severe market overheating.
Hedge Funds Add Positions Against the Trend, Tech Stocks Become Major Buying Targets
Despite the high-profile institutional warning signals, hedge funds' actual operations have moved in the opposite direction.
According to Goldman Sachs Prime Brokerage data, hedge funds made net purchases of U.S. stocks this week for the first time in the past four weeks, driven mainly by short covering of individual stocks. The information technology sector saw the largest net buying volume this week, with fund managers concentrating on covering semiconductor positions, even though the sector as a whole remained in net selling status over the past month.
Leverage metrics have risen simultaneously. The total leverage ratio of U.S. equity long-short funds increased by 1.1 percentage points to 204%, which is at the 4th percentile of the past year; the net leverage ratio rose by 0.7 percentage points to 51.7%, at the 21st percentile. Both figures are in the historically low range, indicating that hedge funds' overall positions remain relatively conservative, and this round of position increases is more of a marginal repair.
Options and Large-Cap Tech Stocks: Bullish Sentiment Rises
Signals from the options market align with hedge funds' direction, with even more pronounced momentum.
According to Barchart data, options traders' bullishness toward the stock market has risen to its highest level since December 2020, with the overall put/call ratio plummeting to 0.61, reflecting a significant increase in bets on upside potential.
Options activity in large-cap tech stocks is equally active. Data from Goldman Sachs' volatility trading desk shows a notable rebound in call option volume for mega-cap tech stocks. Data from Deutsche Bank indicates a slight increase in positions for mega-cap growth stocks and tech stocks, with the large-cap tech stock position reading at 0.65 standard deviations, at the 88th percentile of the past year — which is relatively high but has not yet reached extreme levels.
In addition, according to Sentiment Trader data, buying activity by tech industry insiders has increased significantly, a signal typically seen as participants with informational advantages over company prospects putting real money behind their views.
Retail Investors Retreat, Overall Position Structure Diverges
In contrast to the moves of institutions and hedge funds, retail investors are clearly stepping back from the market.
According to Vanda Research data, retail investors' current pace of stock buying has dropped to its slowest level in more than six years, showing that individual investors' enthusiasm for market participation has cooled sharply.
Looking at overall positions, Deutsche Bank's composite reading shows that equity positions have slightly risen to a "modestly overweight" level this week, with a reading of 0.21 standard deviations, at the 53rd percentile. Large-cap stock positions are slightly higher, at the 68th percentile; large-cap tech stock positions are even higher, at the 88th percentile, but have not entered the extreme zone.
In terms of momentum strategies, according to JPMorgan data, related positions and performance have pulled back from their highs, but no extreme downturn has emerged yet.
Abnormal Volatility Structure: Extreme Divergence Between Individual Stocks and Indices
A notable structural signal currently exists in the market: an extreme divergence has emerged between the implied volatility of individual stocks and that of indices.
Deutsche Bank data shows that implied volatility at the individual stock level is at a high level, while implied volatility at the index level is relatively moderate, and the gap between the two has expanded to an extreme level. This phenomenon corresponds to a market environment with extremely low stock correlation and highly dispersed individual stock returns.
This means that current market risks do not stem from a systemic overall downturn, but rather are more reflected in the sharp divergence among individual stocks. For investors, the importance of stock selection has been significantly amplified in the current environment, while the risk premium captured by a simple index-holding strategy is relatively limited.
This article does not constitute personal investment advice, does not represent the platform's views. The market carries risks, and investment requires caution — please make independent judgments and decisions.
This article is from the WeChat Official Account "Wall Street CN", authored by Bu Shuqing, and published by 36Kr with authorization.