Half focus on risk control, the other half chase speculative "monster stocks" — guess what the final rate of return turned out to be?
1/4
Barbell + Momentum =?
This year is a big year for momentum: the All-A Index has risen by 6.8%, but the median gain and loss of the entire market has actually fallen by -11%. Only 22% of the Shenwan secondary industries have risen in the first half of the year. The glass and fiberglass industry, which has the highest increase, has risen by 188%, while the education industry, which has the largest decline, has fallen by -35%. In contrast, the comparison of gains and losses for the whole of last year was only 146% (aerospace equipment): 14% (liquor), a typical case of "taking from the less to give to the more".
The so - called momentum means the strong get stronger (for an analysis of this strategy, you can read my article "In the same bull market, why is it more difficult to make money in 2025 than in 2020?"). The opposite is "the weak get weaker", which leads to the failure of almost all strategies that are opposite to momentum. The momentum strategy has an advantage in the A - share market anyway, and this year's extreme market has made more people want to try this strategy.
The common momentum strategy is to distribute positions among individual stocks or industry ETFs with the best gains in the past period (such as 120 days or 250 days) and adjust them regularly on a rolling basis.
However, all investors who want to try this strategy should consider one thing: once the momentum strategy fails and collapses, the drawdown will be very terrifying, often several times that of the index drawdown.
A simple momentum strategy is no different from a gambler. Therefore, mature momentum strategies will combine some other strategies to reduce drawdown.
For example, the most classic "risk - return barbell + momentum" strategy divides funds into two ends using a barbell structure. 80% is allocated to low - volatility assets, such as dividend stocks or bond ETFs. The other 20% is allocated to high - elasticity assets, and this part uses momentum screening, for example, only buying growth stocks in the top 5% of gains in the recent 6 months or a year.
The idea of this strategy is to use the barbell at the asset allocation level and use momentum at the stock - selection level. In a bear market, it mainly relies on the left - hand asset allocation to resist the decline, and in a bull market, it mainly relies on the right - hand momentum stock - selection to make money.
This strategy perfectly reflects Taleb's barbell idea - getting rid of the middle layer. The middle layer has neither defensive ability nor sufficient offensive ability, and it is easy to drag down the returns. It is better to concentrate positions on the two ends of extreme safety and extreme offensive power.
The barbell strategy is very easy to understand. Therefore, this article introduces a "dual - momentum strategy" evolved from the barbell strategy, namely "index momentum + industry or individual stock momentum".
Dual - momentum is certainly not "doubling the long - momentum", nor is it simply adding two momentum strategies together. Instead, it hopes to use the complementarity of these two momentums to a certain extent to make the strategy suitable for more market environments as much as possible and reduce drawdown.
2/4
Half for risk control, half for chasing strength
The basic idea of the "dual - momentum" is to divide the funds into two halves. One half is used for the "absolute momentum" of the index. As long as the index is above the long - term moving average, hold the corresponding index ETF with full positions. As soon as the index falls below the moving average, exit and hold cash. The other half is used for the "relative momentum" of industries or individual stocks, that is, rolling - hold the strongest industry ETFs or individual stocks.
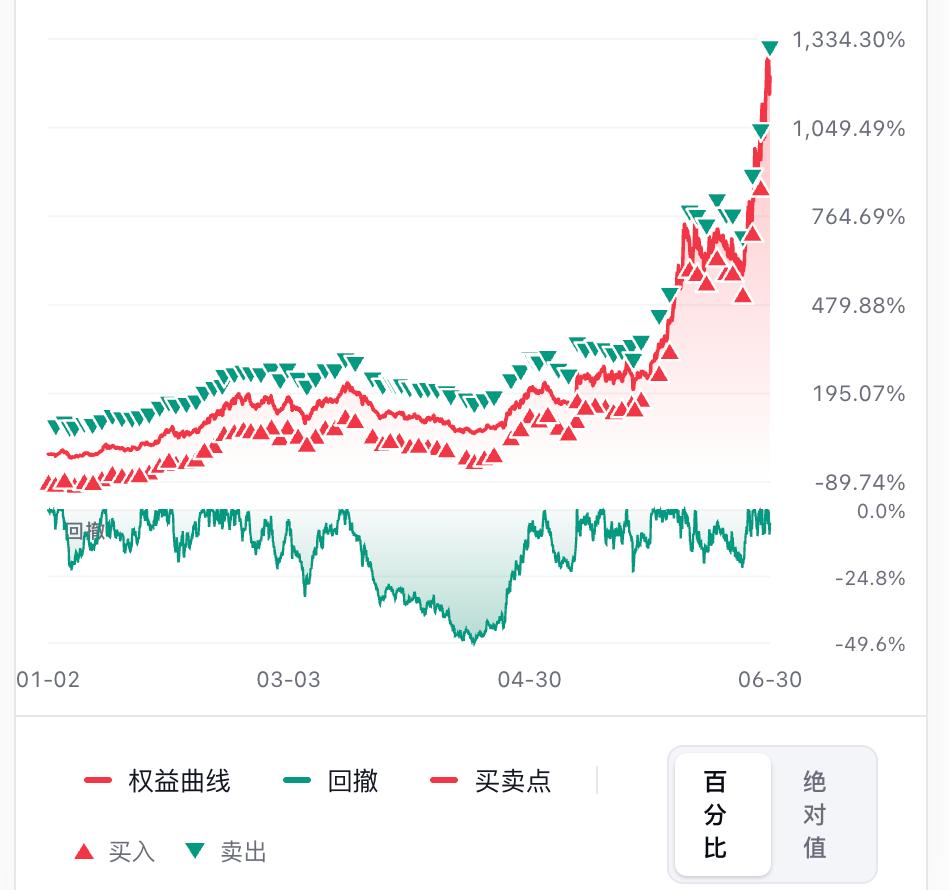
What effect will occur when these two momentums are superimposed? The following is a simulated back - test. Hold the CSI 300 Index ETF with half of the positions. Clear the positions when the index falls below the 250 - day moving average, and continue to hold when it is above the 250 - day moving average. Hold the top 5 stocks with the highest gains in the past 12 months (excluding the most recent month) among the CSI 300 constituent stocks with the other half of the positions, and adjust the positions on a rolling basis at the end of the month.
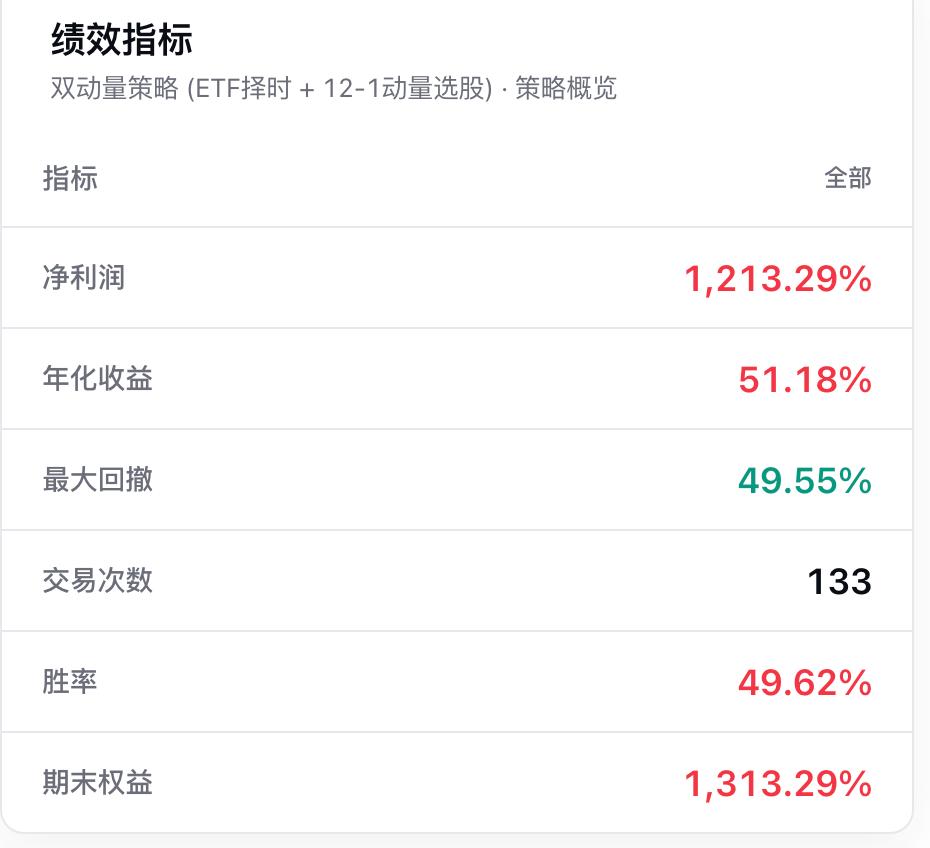
The results of the data back - test over the past six and a half years (from January 2020 to June 2026): the annualized return is as high as 51%, but the maximum drawdown has also reached 50%, which occurred during the bear market from 2022 to 2023, with a Sharpe ratio of 1.27. (Note: this is only a rough back - test of the feasibility of the factor and cannot be regarded as a mature practical strategy. Among them, the changes in historical constituent stocks may inflate both the yield and the drawdown, and the actual buying and selling may not have been established at that time.)
Although the drawdown of this result is still relatively large and the Sharpe ratio is not ideal, it is in a state of being theoretically usable but needing improvement in practice. At least it shows that this strategy is effective for the A - share market.
The directions for improvement include using multiple indexes, adjusting the moving - average parameters, adjusting the number of momentum stocks, changing the position ratio of the two parts to dynamic adjustment, adding low - volatility factors or value - factor requirements to the momentum strategy, etc. But the premise of these improvements is to first know how this strategy works in different market environments?
The principle of the strategy is also the barbell principle: use the first half to control risks, clear the positions when the index falls below the annual line, and then use the second half to continuously chase strength.
Judging from the actual effect, the effect of chasing strength is very obvious. From 2020 to 2021 and from 2024 to 2026, it has significantly outperformed the index. The industry and individual - stock momentum part has contributed most of the returns.
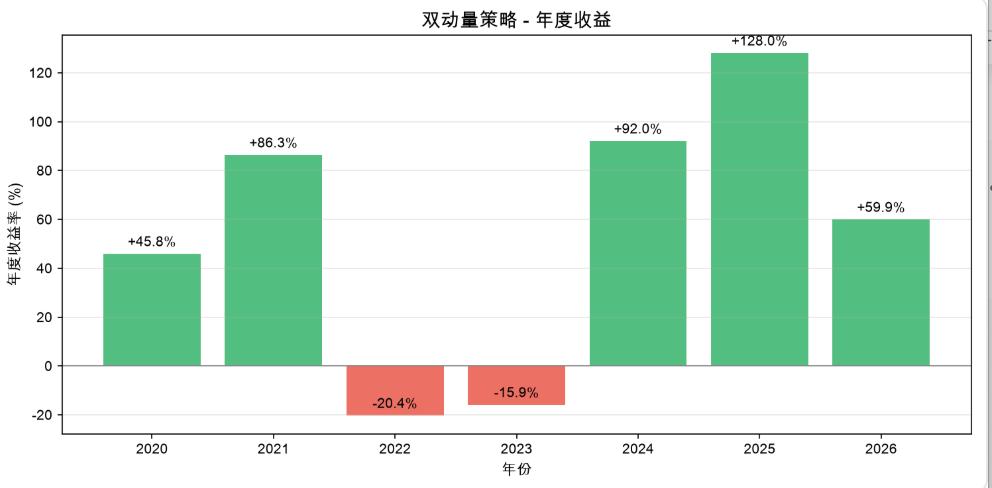
The effect of risk control is barely usable. During the bear markets in 2022 and 2023, the decline was similar to that of the index. For such a simple momentum strategy, there are actually many mature optimization methods.
As for how to optimize it specifically, it is nothing more than superimposing other factors. Each quantitative strategy has its own methods. Considering that most readers of the official account are not quantitative practitioners, it will not be the focus of this article.
For ordinary non - quantitative investors, what is more important is how this strategy works and what inspiration it can bring to your investment portfolio?
This involves what roles the two parts of this strategy play in different market environments?
3/4
Back - test details of the dual - momentum strategy
The index momentum in this strategy is relatively simple. Everyone should understand it at a glance. This strategy can continuously earn beta returns in a clear bull market and avoid the risk of a sharp decline in a clear bear market. However, it has three "ineffective periods":
1. It cannot earn money during the period when the market turns from a bear to a bull (from March to April 2020).
2. It cannot avoid the drawdown during the period when the market turns from a bull to a bear (the first quarter and the second half of 2021).
3. The worst is that in a volatile market where the bull - bear situation is unclear, it repeatedly buys high and sells low and loses money.
In fact, the first and second scenarios often also manifest as a volatile market. In fact, they are all problems of "the trend strategy repeatedly losing money in a volatile market".
The dual - momentum strategy takes into account the complementarity of these two momentum strategies, namely:
1. Can the industry and individual - stock momentum make up for the defects of the index momentum in a balanced market?
2. Do the drawdowns of the industry and individual - stock momentum all occur during the trend - market stage of the index momentum?
The answer to question 1 is "it can make up", but only partially, depending on at which level the index volatility occurs:
If it is volatility at the index level, but there are still structural market trends internally, the individual - stock or industry momentum can often make up for the losses caused by the repeated stop - losses of the index momentum.
For example, at the end of the bear market in the first half of 2024, although the index repeatedly fluctuated around the annual line and all four transactions were stopped at a loss, with a loss of 3%, the momentum stocks represented by "Yi Zhongtian" and dividend stocks performed extremely well. Relying on the individual - stock momentum, the strategy achieved an amazing return of over 60% during this balanced market.
Also in the first half of 2023, although the index repeatedly fluctuated around the annual line and all eight transactions were stopped at a loss, with a loss of - 13%; but the market structure was still relatively clear, which was the first wave of the AI market, with the dual main lines of computing power and applications, and the two major industries of gaming and communication equipment leading the rise, and many bull stocks emerging. The individual - stock momentum made up for a considerable part of the losses, and the actual loss of the strategy in the first half of the year was reduced to - 10%.
In addition, it was similar in the first half of 2020, where the individual - stock momentum saved the index momentum.
However, if both the index and the industries enter a full - scale volatile period, the index repeatedly crosses the moving average, all industries rotate extremely fast, and there are no leading stocks, and the market is in a state of chaos, then both parts of the "dual - momentum" strategy will fail simultaneously.
However, this situation has not occurred during the six - and - a - half - year back - test of this strategy, which is also one of the reasons why the returns of this strategy have performed very well. But since it exists in theory, it is believed that it can be found if the back - test time is extended.
Regarding question 2, when the individual - stock momentum fails, there will be a large drawdown. Can the index momentum have a trend - market stage at this time to alleviate the drawdown of the entire strategy?
The answer is also "mostly so". During the back - test period, the momentum failures all occurred during the trend - market stages of a bull market (the failure of the industry momentum from 2020 to 2021) or a bear market (part of the period from 2022 to 2023). Of course, based on the above judgment, since it exists in theory, it is believed that it can be found if the back - test time is extended.
Then, why does a drawdown as high as 50% still occur?
The longest and largest drawdown period of the dual - momentum strategy occurred from August 2022 to October 2023. As analyzed before, the drawdown in the first half of 2023 was mainly caused by the failure of the index momentum. Therefore, the real failure of the individual - stock and industry momentum occurred in the second half of 2022 and from July to October 2023.
The second - largest drawdown of the strategy occurred from September 2021 to April 2022.
During these three periods, the CSI 300 Index was below the annual line for most of the time. Holding cash is equivalent to reducing half of the drawdown. It's just that the drawdown of a pure momentum strategy is really terrifying, and finally there were still - 32% and - 50% drawdowns.
Therefore, there is a lot of room for optimization and mature methods for this strategy itself.
If you look more closely, you can also see three details:
1. The individual - stock momentum is effective, but the industry momentum is ineffective. For example, from 2020 to the first half of 2021, the strong industries included consumer stocks mainly in the consumer and pharmaceutical sectors, as well as the "Ning Index" mainly composed of technology stocks such as semiconductors and new energy. The industry momentum was not obvious, and the rotation feature was obvious. However, the market was concentrated on the individual stocks of the "Mao Index", and the individual - stock momentum was obvious. Therefore, during this one - and - a - half - year period, the strategy's return could still rise by 125%.
2. Two momentum reversals at the bottom of the bear market. Around February and September 2024, there were strong momentum reversals and short - term failures of the momentum strategy. In the first case, the index momentum held cash, reducing the drawdown and protecting the net value. In the second case, it was a V - shaped reversal, and the market was fully invested in the index on the third day, hedging the drawdown caused by the momentum reversal.
3. The temporary failure of momentum in a bull market was mainly the drawdown of the small - and - micro - cap momentum around September 2025, which affected the strength of technology stocks. However, since the CSI 300 was in a strong trend, this momentum drawdown was reduced.
It can be seen that although these two momentums are not absolutely negatively correlated, there is a complementary relationship most of the time. Therefore, in addition to improving the drawdown of the individual - stock and industry relative momentum itself, the index momentum can also be used as a "filter" for the individual - stock and industry momentum, and the positions of the two parts can be dynamically adjusted:
1. If the index repeatedly crosses the moving average, it means that the market has no obvious direction. Then reduce the weight of the index momentum, for example, to 30%, and allocate more funds to the industry and individual - stock momentum.
2. If the index shows a clear trend and continuously stands above the long - term moving average, then increase the weight of the index momentum, for example, to 70%. Because at this time, the index trend itself is already reliable enough. It is better to reduce the drawdown risk caused by the possible reversal and rotation of chasing the industry or individual - stock momentum.
4/4
Market - state recognition above stock - selection
From a fundamental perspective, momentum stock - selection is prosperity - based investment, which also conforms to the general law of a company's business entering a virtuous cycle.
A company's business has obvious characteristics of "When fortune smiles, heaven and earth lend their aid; when luck deserts, even heroes are helpless." Industrial prosperity will improve a company's operating efficiency, leading to profit growth. The company's bargaining power with upstream and downstream partners will increase, and it will be more able to attract excellent talents. The internal employees will also be more motivated, which in turn promotes the further improvement of the company's performance.
When you see a company's performance improving