Latest! A map showing the second-hand housing prices in the top ten cities in February 2025.
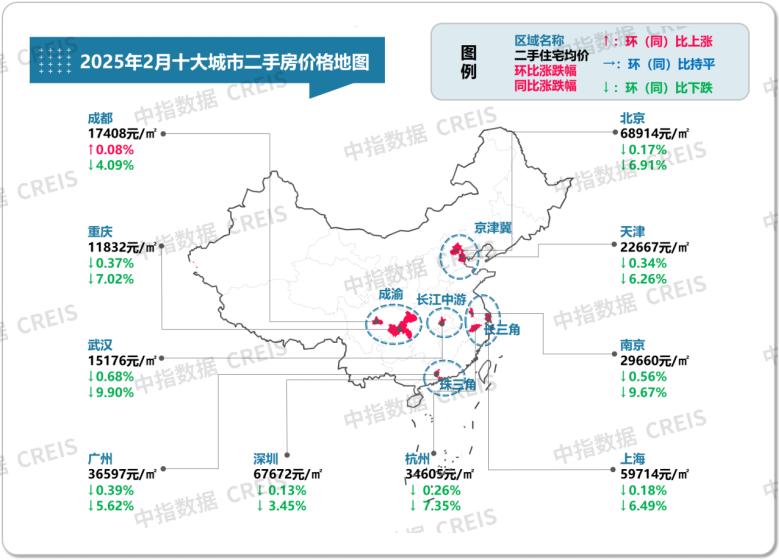
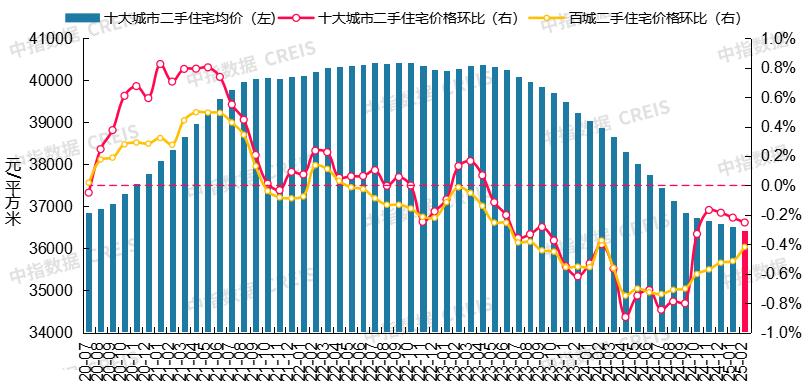
According to the China Real Estate Index System's Hundred - City Price Index, in February 2025, the average price of second - hand residential properties in 100 cities decreased by 0.42% month - on - month, with the decline narrowing by 0.1 percentage points, and decreased by 7.26% year - on - year. The average price of second - hand residential properties in the top ten cities decreased by 0.25% month - on - month and 6.32% year - on - year.
Chart: List prices, month - on - month and year - on - year changes of second - hand residential properties in the top ten cities in February 2025
Data source: China Index Academy's CREIS
Chart: Average prices and month - on - month changes of second - hand residential properties in the top ten cities from July 2020 to February 2025
Data source: China Index Academy's CREIS
Looking at each city, in terms of month - on - month changes, in February, the price of second - hand residential properties in Chengdu increased by 0.08%, marking four consecutive months of increase.
Wuhan and Nanjing saw relatively large month - on - month declines of 0.68% and 0.56% respectively. Guangzhou, Chongqing (main urban area), Tianjin, and Hangzhou had month - on - month declines ranging from 0.2% to 0.4%. Shanghai, Beijing, and Shenzhen had month - on - month declines ranging from 0.1% to 0.2%.
In terms of year - on - year changes, in February, Wuhan and Nanjing saw year - on - year declines of 9.90% and 9.67% respectively. Hangzhou and Chongqing (main urban area) saw year - on - year declines of 7.35% and 7.02% respectively. Beijing, Shanghai, Tianjin, and Guangzhou had year - on - year declines ranging from 5% to 7%. Chengdu and Shenzhen had year - on - year declines of less than 5%, with Shenzhen having the smallest decline at 3.45%.
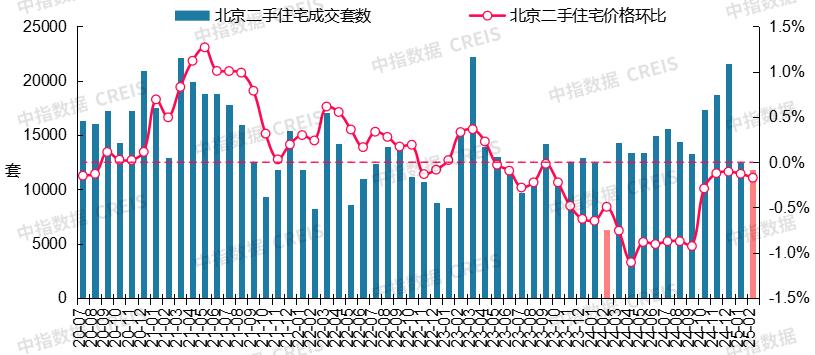
Beijing: The second - hand housing market gradually regained momentum after the Spring Festival, with transaction volume increasing year - on - year for five consecutive months
In terms of transactions, after the Spring Festival, the second - hand housing market in Beijing showed signs of recovery. Homebuyers visited properties more frequently than before the festival, and the weekly transaction volume gradually increased. In February, 11,876 second - hand residential properties were sold in Beijing, a year - on - year increase of 87.6%, marking five consecutive months of year - on - year growth. From January to February, the cumulative year - on - year increase was 29.7%.
Chart: Number of second - hand residential property transactions and month - on - month price trends in Beijing from July 2020 to February 2025
Data source: China Index Academy's CREIS
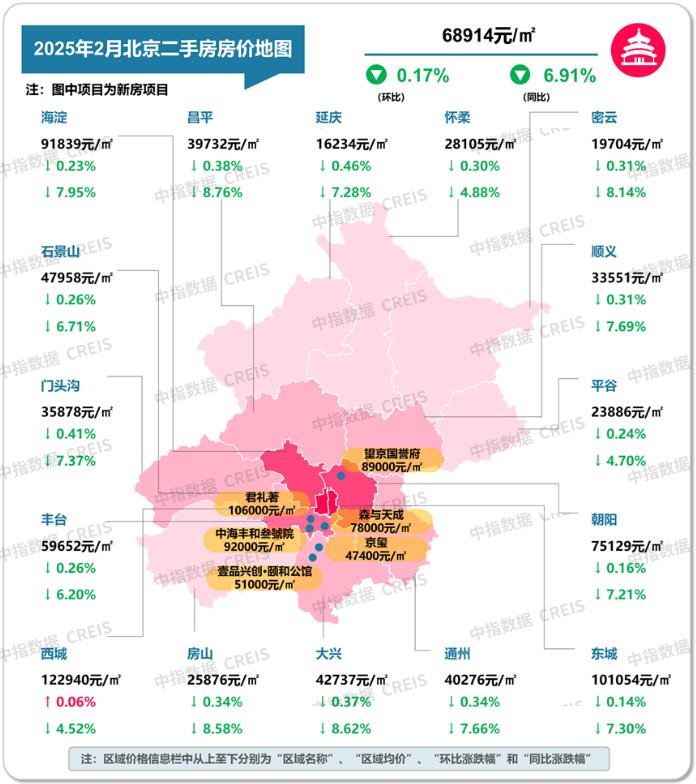
In terms of prices, in February, the price of second - hand residential properties in Beijing decreased by 0.17% month - on - month and 6.91% year - on - year, with the year - on - year decline narrowing for four consecutive months. Looking at different districts, prices in Xicheng, Dongcheng, Chaoyang and other areas remained relatively stable, while suburban areas were still accelerating the clearance of properties through "special - price listings".
Chart: List prices, month - on - month and year - on - year changes of second - hand residential properties in each district of Beijing in February 2025
Data source: China Index Academy's CREIS
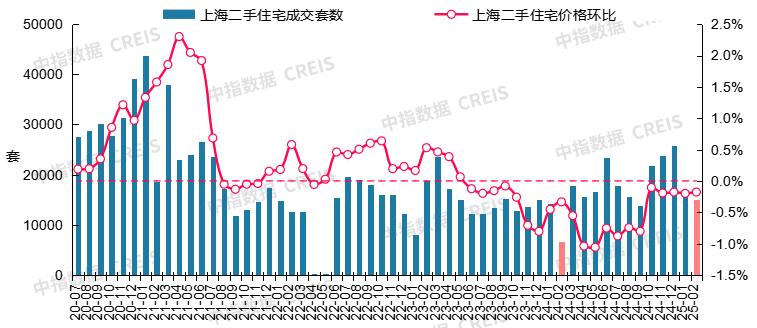
Shanghai: Both month - on - month and year - on - year price declines of second - hand houses narrowed in February, and transaction volume increased significantly year - on - year due to the low base
In terms of transactions, after the festival, the market for subway - accessible and school - district properties in the central urban area of Shanghai recovered quickly. In February, 14,982 second - hand residential properties were sold, a year - on - year increase of 127.1%. From January to February, the cumulative year - on - year increase was 47.2%.
Chart: Number of second - hand residential property transactions and month - on - month price trends in Shanghai from July 2020 to February 2025
Data source: China Index Academy's CREIS
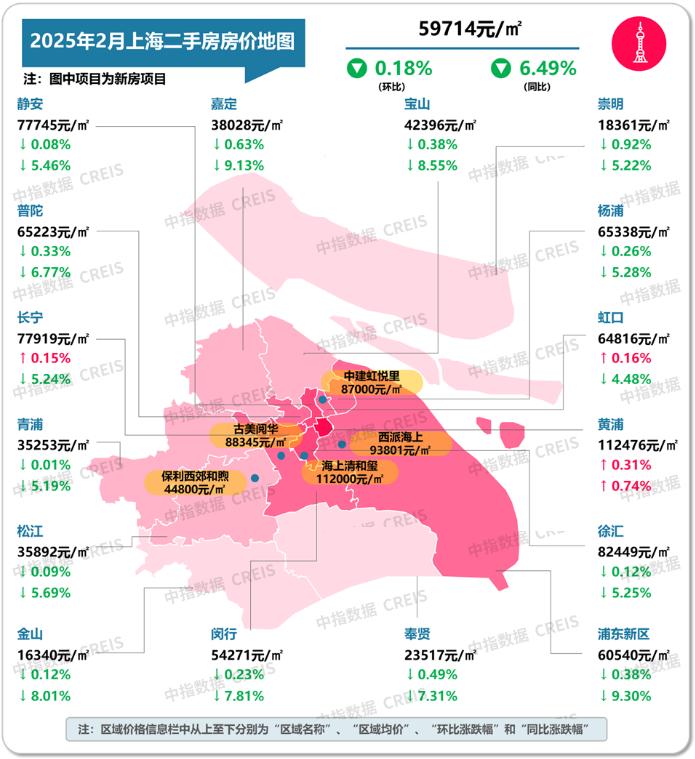
In terms of prices, in February, the price of second - hand residential properties in Shanghai decreased by 0.18% month - on - month, with the decline narrowing by 0.02 percentage points compared to the previous month, and decreased by 6.49% year - on - year, with the year - on - year decline narrowing for five consecutive months.
Chart: List prices, month - on - month and year - on - year changes of second - hand residential properties in each district of Shanghai in February 2025
Data source: China Index Academy's CREIS
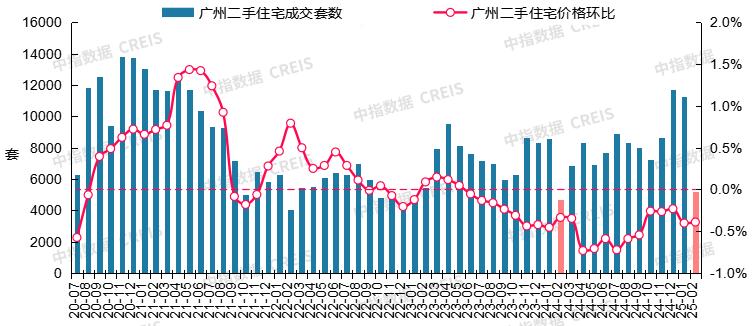
Guangzhou: The phenomenon of trading at lower prices to increase volume in the second - hand housing market continued, and the month - on - month price decline narrowed
In terms of transactions, after the Spring Festival, the second - hand housing market in Guangzhou recovered quickly, and buyers were more willing to enter the market. Properties with high - quality educational resources in Nansha, Liwan, Huangpu and other areas performed well. However, since the number of second - hand housing listings in Guangzhou remained high, market transactions were still mainly for properties with large price cuts. In February, 5,184 second - hand residential properties were sold in Guangzhou, a year - on - year increase of 10.5%. From January to February, the cumulative year - on - year increase was 23.7%.
Chart: Number of second - hand residential property transactions and month - on - month price trends in Guangzhou from July 2020 to February 2025
Data source: China Index Academy's CREIS
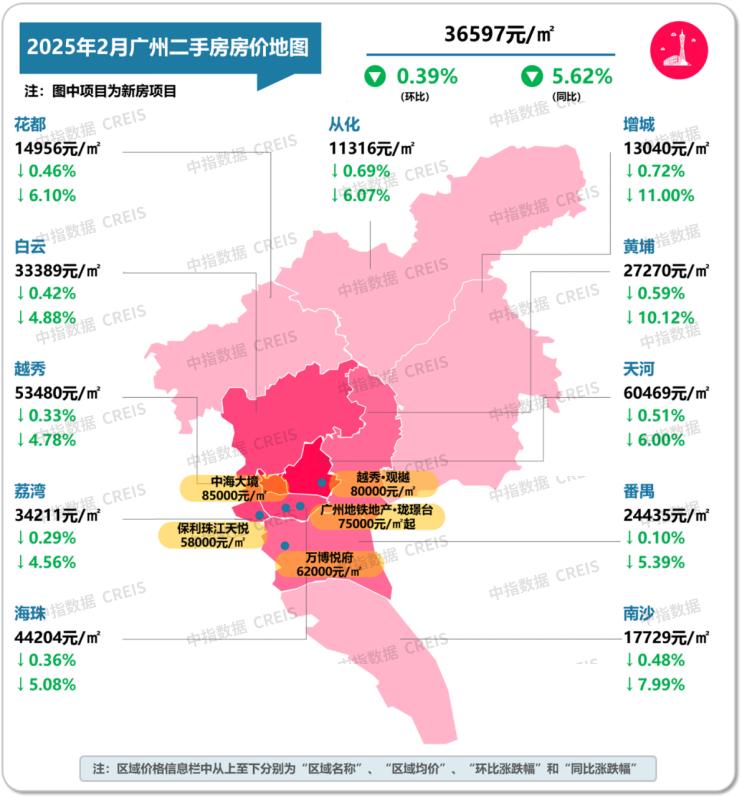
In terms of prices, in February, the price of second - hand residential properties in Guangzhou decreased by 0.39% month - on - month, with the decline narrowing slightly compared to the previous month, and decreased by 5.62% year - on - year.
Chart: List prices, month - on - month and year - on - year changes of second - hand residential properties in each district of Guangzhou in February 2025
Data source: China Index Academy's CREIS
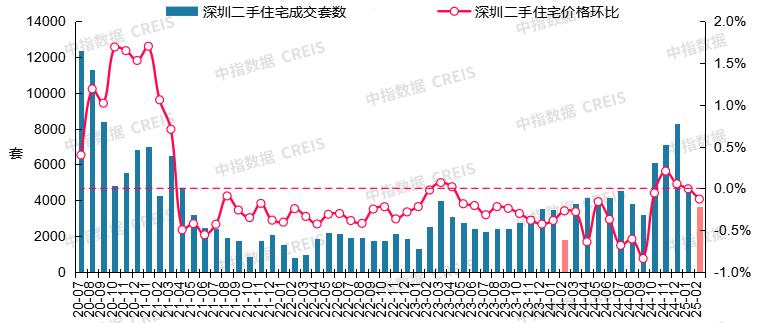
Shenzhen: Second - hand housing transactions continued to recover after the festival, and the year - on - year price decline narrowed for five consecutive months
In terms of transactions, after the Spring Festival, the second - hand housing market in Shenzhen recovered quickly, and the number of transactions increased month - on - month for three consecutive weeks. In February, 3,677 second - hand residential properties were sold in Shenzhen. Affected by the low base, the year - on - year increase was 106.0%. From January to February, the cumulative year - on - year increase was 56.8%.
Chart: Number of second - hand residential property transactions and month - on - month price trends in Shenzhen from July 2020 to February 2025
Data source: China Index Academy's CREIS
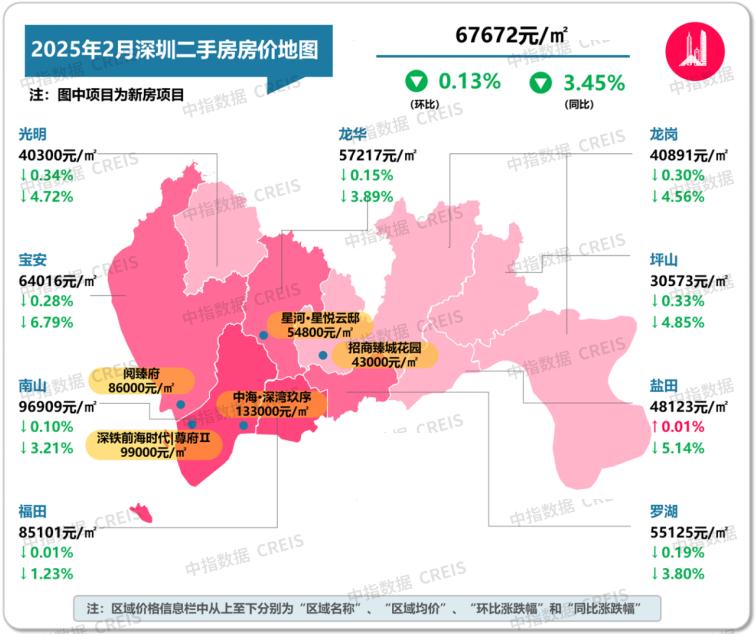
In terms of prices, in February, the price of second - hand residential properties in Shenzhen decreased by 0.13 month - on - month and 3.45% year - on - year, with the year - on - year decline narrowing for five consecutive months.
Chart: List prices, month - on - month and year - on - year changes of second - hand residential properties in each district of Shenzhen in February 2025
Data source: China Index Academy's CREIS
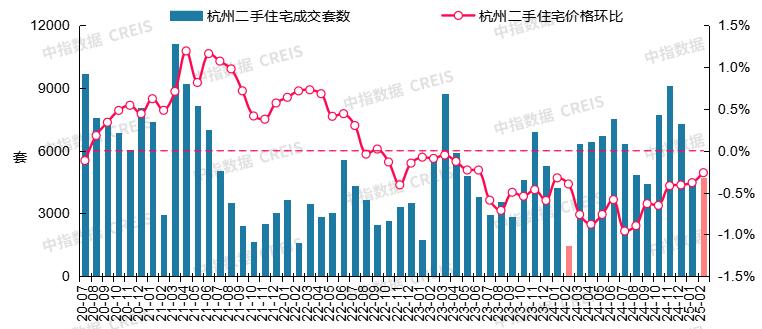
Hangzhou: Both month - on - month and year - on - year second - hand housing transactions increased, and the month - on - month price decline narrowed for four consecutive months
In terms of transactions, after the festival, the market gradually warmed up. In particular, the number of property viewings for second - hand houses increased significantly in the second half of the month. In February, 4,714 second - hand residential properties were sold in Hangzhou, a month - on - month increase of 3.7% and a year - on - year increase of 220.9%. From January to February, the cumulative year - on - year increase was 62.7%.
Chart: Number of second - hand residential property transactions and month - on - month price trends in Hangzhou from July 2020 to February 2025
Data source: China Index Academy's CREIS
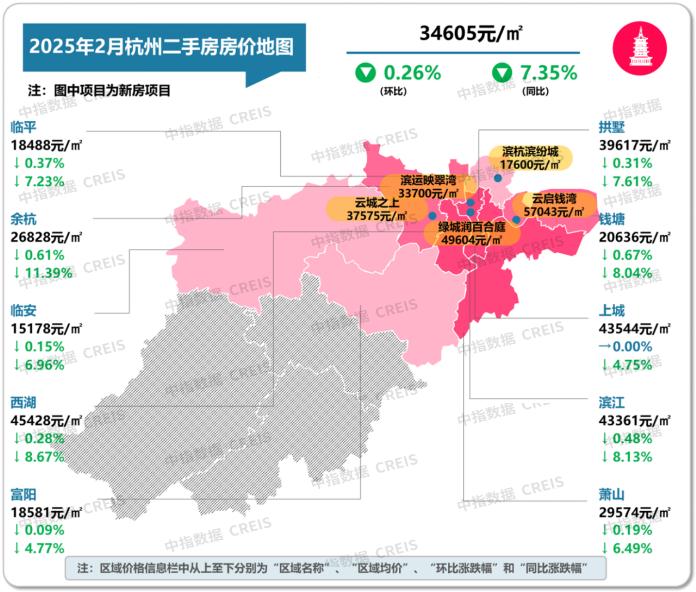
In terms of prices, in February, the price of second - hand residential properties in Hangzhou decreased by 0.26% month - on - month, with the decline narrowing by 0.12 percentage points compared to the previous month, marking four consecutive months of narrowing month - on - month decline. Looking at different areas, the prices of high - quality second - hand new houses in the core area were relatively stable, while the listed prices of some properties in the suburban rigid - demand areas, such as the Donghu area in Linping, were significantly reduced.
Chart: List prices, month - on - month and year - on - year changes of second - hand residential properties in each district of Hangzhou in February 2025
Data source: China Index Academy's CREIS
Nanjing: The second - hand housing market will continue to face pressure in the short term due to the high number of listings
In terms of transactions, after the Spring Festival, homebuyers were more willing to visit properties and make purchases, and market confidence was restored to some extent. However, since the number of second - hand housing listings in Nanjing was high and the bargaining space was large, the buyer's market characteristics were still obvious. In February, 7,847 second - hand residential properties were sold in Nanjing, a year - on - year increase