Tools, skills and memory are interconnected to form a network. Peking University and other relevant institutions have proposed the self-evolving program graph PG, which gets smarter the more it is used.
When an Agent is already capable of invoking tools, utilizing skills and storing memories, a further question arises: how do these capabilities coordinate during tasks, and how do they accumulate reusable experience from past executions?
Being able to look up flight ticket prices does not mean the Agent knows it should stop after getting the result; being able to save notes does not equate to knowing to read the notes back before the next decision. Agents also need to handle the sequence, conditions and connections between different operations.
Researchers from Google, the Georgia Institute of Technology and Peking University proposed Procedural Graphs (PG) targeting this problem, which organizes tool calls, skill steps, internal reasoning and task states into conditional connections, providing Agents with the basis for "what action to take next".
Paper: https://arxiv.org/pdf/2609.09153
From the perspective of the Agent harness — the execution support system surrounding the model — PG provides a way to connect components such as tools, skills and memory into a network, describing under what conditions these capabilities are used, how they are connected, and which errors need to be avoided.
When executing tasks, the Agent reads the subgraph near the current step to generate guidance adapted to the current scenario; in the offline phase, the system proposes graph modification plans based on execution trajectories, and decides whether to retain the modifications after independent verification.
In this way, experience becomes a procedural relationship that can be read, inspected and revised, and updating the graph does not require retraining the model weights.
From Independent Components to Procedural Relationships: What Does a Single Graph Connect?
Tools, Skills and Memory each have their own functions. Tools provide specific operations such as query, calculation or submission, skills encapsulate reusable practices, and memory retains task information and historical experience. During execution, the Agent also needs to judge: when to read memory, which tool needs to be called for a specific skill, and what to save after obtaining the result.
PG explicitly writes these connection relationships into "process-relationship-process" triples.
A node can be a skill, a tool function, an internal reasoning step, or a task state. The directed edge connecting two nodes describes the relationship of transitioning from the current step to the subsequent step, and contains three fields: applicable condition, execution guidance and pitfalls to avoid.
For example, "predict cash flow" can be connected to "apply for financing". The condition of this edge is that the estimated cash support time is lower than the safety buffer; the guidance is to apply in advance to leave enough time for the funds to arrive; the pitfall to avoid is to submit repeated applications when a previous application has not been completed.
In this way, the same tool action obtains a more complete usage context: why it is called now, what conditions need to be met before the call, and under what circumstances the Agent should wait.
Knowledge graphs usually organize facts in the form of "entity-relationship-entity", helping the system answer "what it is" and "where it is". Procedural Graphs focus on another type of knowledge: what to do, in what order to do it, and under what conditions to do it.
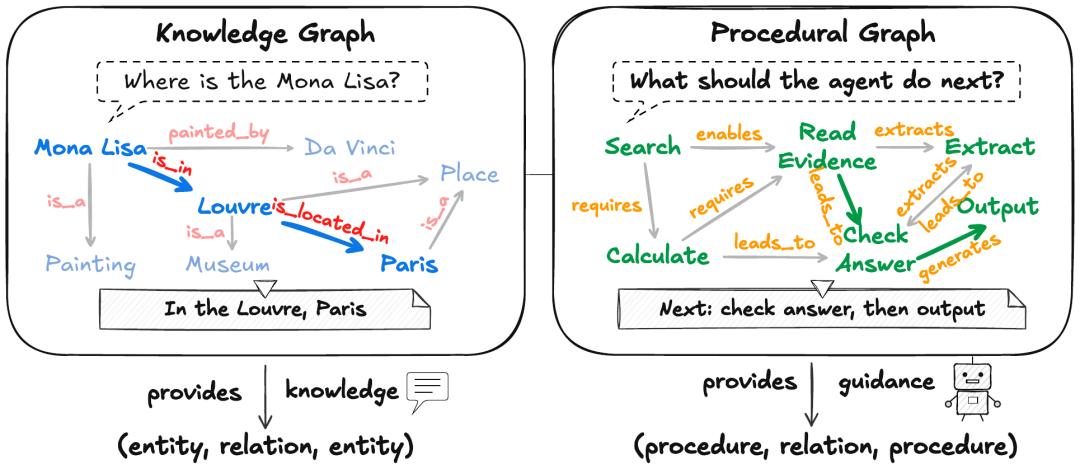
Figure 1 | Knowledge graphs organize facts, while Procedural Graphs connect the steps, conditions and execution guidance of completing tasks. Source: Figure 1 in the paper.
The usage of memory can also be integrated into this structure. The financial Agent in the appendix of the paper provides a specific example: the evolved graph first connects cash check, cash flow prediction, save_note and market data check; then, it connects recall_notes to the starting position of each month, so that the key information saved last month can be retrieved before the new round of decision-making.
In this scenario, tools are responsible for query and calculation, notes store cross-month information, and PG describes when to write, when to read, and how the read and write operations connect to subsequent decisions. Tool calls and memory read-write operations thus become steps in the same procedural network.
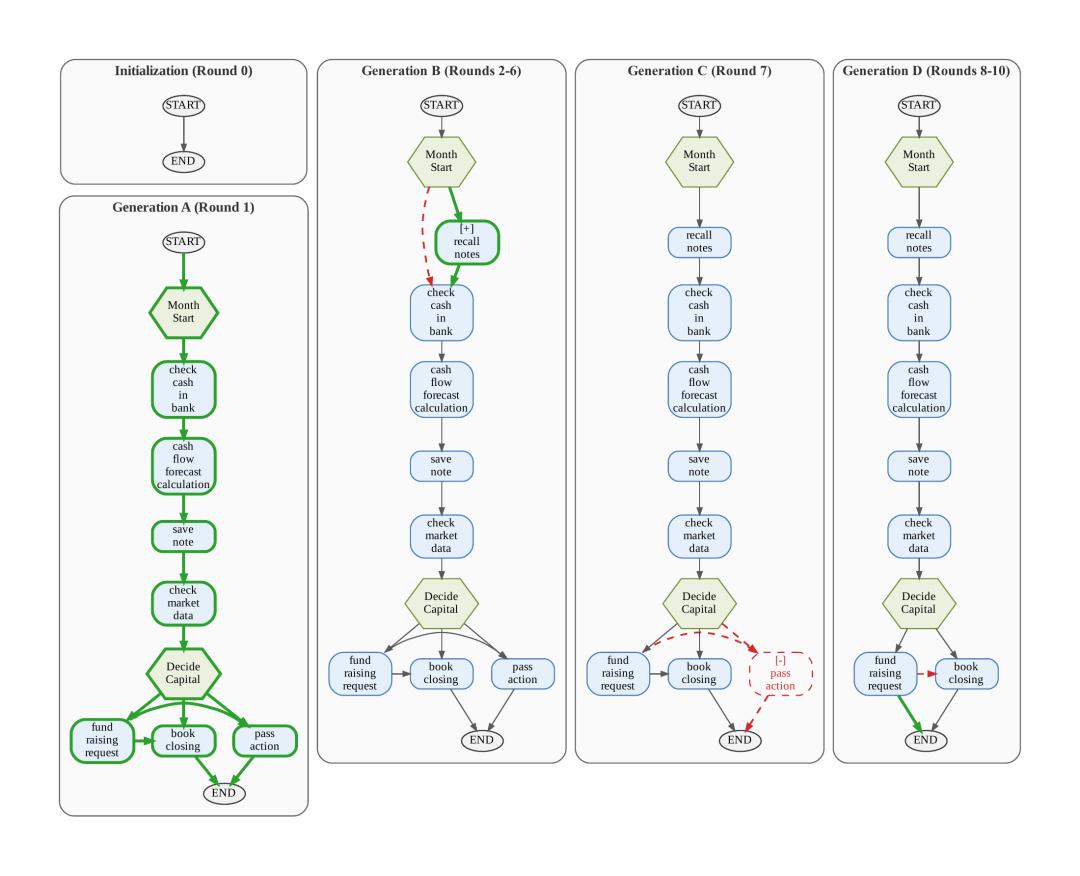
Figure 2 | Structural evolution of the financial Agent's Procedural Graph. Steps including cash check, cash flow prediction and note saving are gradually added to the graph, and note recall is connected at the beginning of each month; subsequent rounds continue to adjust the action branches. Green indicates newly added nodes or connections, and red dotted lines indicate deletions. Source: Figure 5 in the paper.
PG itself also carries procedural memory: the action patterns verified by tasks are stored in the graph structure outside the model weights. When researchers need to modify a condition or add an inspection step, they can directly modify the graph and then test its impact on execution results.
Online Guidance: Read Local Subgraphs According to Execution Position
After organizing procedural relationships into a graph, it is necessary to determine what content to read at each step.
The full graph contains complete information, but may also bring in a large number of branches that are irrelevant to the current task. Independently retrieving several pieces of guidance with similar semantics may miss the connections between steps. For example, if the Agent only retrieves the guidance for "submit" but does not retrieve the previous "check answer" step, it may lack the basis for judging when submission is allowed.
PG organizes online guidance into three consecutive operations.
Locate the current step. The system matches the node in the graph according to the most recently executed action to determine the current position of the Agent.
Extract connected local structures. By default, the subgraph within two hops along the outgoing edges is read, that is, steps that can be reached from the current position through at most two connections. If no node is matched, the system falls back to the full graph.
Generate guidance for the current scenario. The guidance model combines the local subgraph, user tasks and recent execution records to generate suggestions for the next step, which are added to the prompt of the execution model. The final action is still selected by the execution model.
In the paper experiments, the guidance model and the execution model adopt the same base LLM. The graph remains fixed when executing a single task.
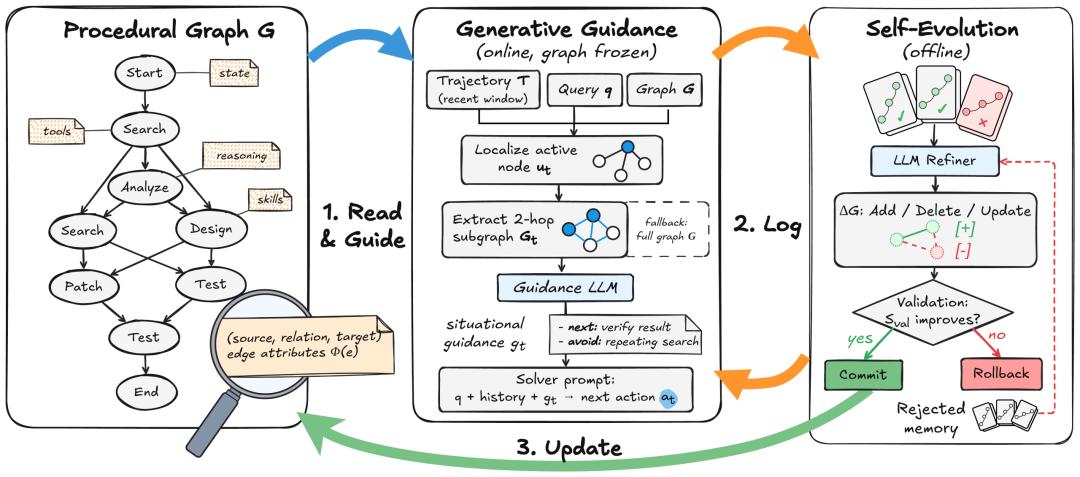
Figure 3 | Locate the current node during execution, read the local subgraph and generate guidance; modify the graph according to the trajectory in the offline phase, and retain the modification after passing the structural check and when the verification score does not decrease (including equal scores). Source: Figure 2 in the paper.
A flight ticket query case demonstrates how this kind of guidance affects the end timing of tasks. In the BFCL tool call test, the user only wants to know the economy class ticket price. The no-graph baseline obtained a quotation of 220 USD, but continued to authenticate, operate the bank card and try to book the ticket; after the failure, it also modified the budget limit and completed the booking again.
Using the same Gemini 3.5 Flash, the Agent under PG guidance ends the current round after reporting the 220 USD price and waits for new instructions from the user. This case reflects one function of procedural knowledge: helping the Agent judge whether the existing operations have met the current request.
Offline Evolution: Revise Procedural Graphs from Execution Feedback
The effectiveness of a Procedural Graph depends on what is stored in it. The manually written process seems reasonable, but it may also cause problems in actual execution.
The paper conducts graph construction experiments on MultiChallenge. This experiment uses Gemini 3.5 Flash and includes 56 test samples: the success rate of the no-graph baseline is 87.50%, it drops to 58.93% after adding the manual expert graph, and reaches 53.57% after the model performs one static update.
This set of results shows that modifications to procedural relationships need to be verified through task tests. For this purpose, PG designs an offline loop: execute tasks, analyze trajectories, propose modifications, and verify candidate graphs.
The system first runs the currently retained graph on a batch of training tasks, then the revision model compares the high-score and low-score trajectories to find repeatedly occurring errors or reusable steps. Modifications can add missing nodes and connections, delete paths that easily lead to failures, and rewrite the conditions, guidance and notes on the edges.
The candidate graph first passes the structural check, and then runs on the independent verification set. The system adopts this modification only when the measured verification score is not lower than that of the currently retained graph; modifications with equal scores can also be retained. Rejected plans and their results will be recorded for subsequent revision reference.
These changes occur between offline batches. Therefore, the Agent in execution reads the current version of procedural knowledge, and new experience is incorporated into subsequent versions after being verified.
In the aforementioned MultiChallenge construction experiment, starting from the expert graph with a 58.93% success rate, the success rate after iterative evolution reaches 92.86%, which is 33.93 percentage points higher than the expert initialization, and also exceeds the 87.50% no-graph baseline.
One verification sample in the appendix of the paper requires the Agent to tell a joke while following the previous constraint of "only using passive voice". However, the Agent guided by the second-generation candidate graph deviates from the task and instead answers the evaluation question attached to the environment — whether the model always uses passive voice, with the reply starting with "passive voice is not always used".
The third-generation candidate graph deletes the connection leading to direct termination, and rewrites the guidance for "extract constraint → end", requiring the Agent not to answer the evaluation question directly. This time, the Agent gives a joke after completing the constraint extraction step, and the success mark of this verification sample changes from 0 to 1.
This case provides a specific observable object for "experience update": which connection is deleted, which guidance is rewritten, and what changes occur in subsequent executions.
The researchers also tried to evolve starting from the minimal graph structure. In the HotpotQA construction experiment, the PG obtained through this method achieves an answer F1 score of 78.79, which is higher than the 71.21 of the no-graph baseline, indicating that the procedural structure can also be gradually established from execution feedback.
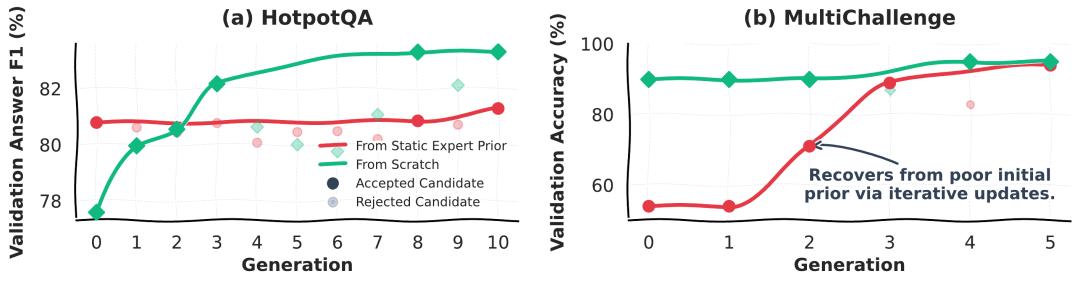
Figure 4 | Evolution trajectories starting from the expert graph or the minimal graph structure. Both sets of experiments use Gemini 3.5 Flash: the left figure shows the answer F1 score on the HotpotQA verification set, and the right figure shows the accuracy on the MultiChallenge verification set. Solid markers represent adopted candidates, and light-colored markers represent rejected candidates; the indicators in the figure come from the verification set, which are counted separately from the test set results mentioned above. Source: Figure 6 in the paper.
Task Evaluation: Performance in Tool Calls and Long-Term Decision-Making
The evaluation in the paper covers multi-hop question answering, multi-turn instruction following, professional tasks, interactive environments, tool calls and long-term financial decision-making. All methods use the same ReAct execution framework to compare different experience storage and reuse methods.
On the tool call benchmark BFCL v3, the accuracy of Gemini 3.5 Flash with PG reaches 67.00%, while the strongest baseline of this group is 58.00%. On the professional task GDPval and the τ-bench that requires compliance with business rules, Gemini 3.1 Pro also obtains performance improvements.
Long-term tasks further examine the temporal relationship between actions. In EnterpriseArena, the Agent manages a simulated enterprise and continuously makes financial decisions for up to 132 months, needing to cope with cash flow changes, fund arrival delays and economic shocks.
After a financing application is submitted, it takes one to six months for the funds to arrive. If the application is submitted when cash is about to run out, the enterprise may not survive the waiting period. Trajectory analysis shows that the Agent under PG guidance checks cash flow earlier, predicts funding gaps, and submits financing applications in relatively stable months.
Each configuration was tested for 50 simulation runs. Compared with the no-graph baseline, the survival rate of Gemini 3.1 Pro to complete the entire simulation cycle increases from 6.0% to 34.0%; the survival rate of Claude Sonnet 4.6 increases from 44.0% to 58.0%.
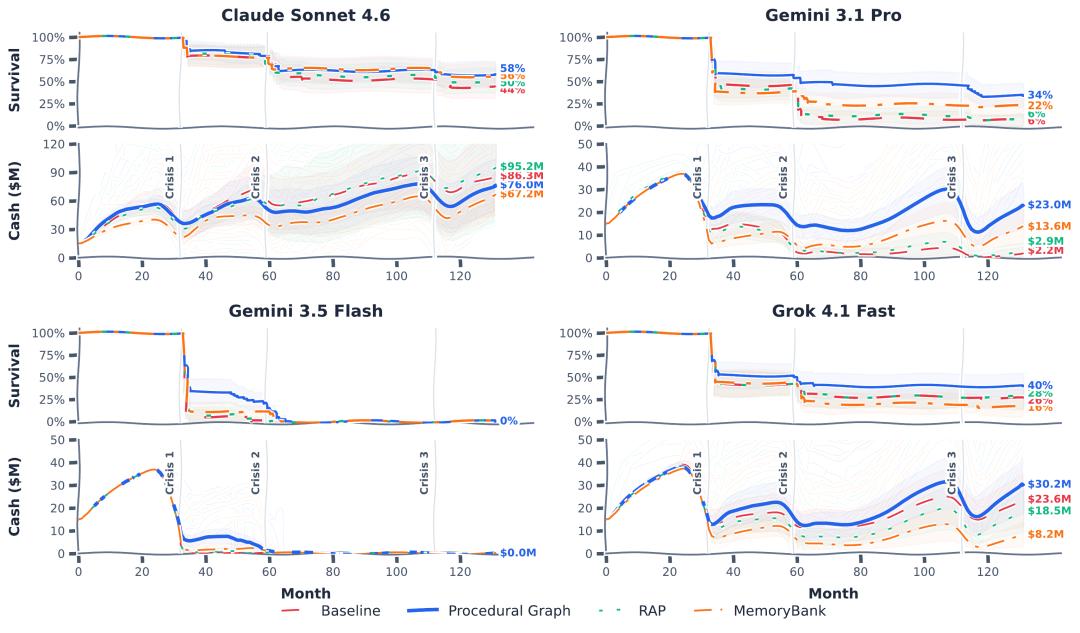
Figure 5 | Long-term decision-making performance of four models in EnterpriseArena. The survival curve is shown above each model panel, and the cash balance (in millions of USD) is shown below; each configuration is tested for 50 simulation runs, with a maximum duration of 132 months. Blue represents PG, red represents the no-graph baseline, green and orange represent RAP and MemoryBank respectively; the vertical lines mark the time points of economic shocks. Source: Figure 3 in the paper.
Procedural knowledge in such tasks needs to connect current operations with delayed outcomes. The aforementioned memory read-write process also serves this kind of sequential decision-making: save the key information of the previous month, retrieve it before the new round of actions, and combine it with the current state to continue making judgments.
Benefits and Costs of Local Guidance
The paper compares whether local subgraphs are more suitable for current decision-making than the full graph through ablation experiments.
On the ALFWorld fixed test subset using Gemini 3.5 Flash, when generating guidance based on the full graph, the success rate is 54.48%; after using the same graph and switching to local subgraph guidance, the success rate reaches 81.53%. The average token consumption per sample drops from 96,360 to 28,064, which is about 70.9% lower than full-graph generative guidance.
This result supports the design of reading relevant procedural relationships according to execution positions. However, local guidance still has additional overhead: the no-graph baseline in the same experiment uses an average of 18,055 tokens, which is lower than that of local subgraph guidance. Offline operation and candidate graph verification also require computing resources.
The benefits also vary across different tasks. In the main HotpotQA question answering experiment, the gap between PG and the strongest baseline of each model ranges from a 0.90 percentage point decrease to a 1.30 percentage point increase, which is smaller than that of the aforementioned tasks. How much performance the Procedural Graphs can retain when reused across different models and