Estimation of AI computing power capital expenditure: The figure of 3 to 4 trillion US dollars is calculable, but the conditions for its full realization are extremely harsh.
The implementation of Agent technology has empowered large language models with real "hands" and "feet": the leap in Coding capabilities and the maturity of tool invocation have pushed AI from a "conversational assistant" to a new level of "autonomous executor". On the other hand, the overall tightness of the supply chain has driven the market to fully embrace hardware, and the widely circulated investment adage goes: "The US is short of power, China is short of chips, and storage is always in shortage".
As North America enters the earnings season, the AI narrative stands at a delicate crossroads: the capital expenditure of major manufacturers exceeds expectations, but the share prices of global AI hardware have come under significant successive pressure.
All debates revolve around what the upper limit of North America's AI computing power capital expenditure will be in the future. The relatively optimistic expectation in the actual market is already not low, and Semi Analysis recently predicted that the new power demand of US AI data centers will grow rapidly from 21GW in 2026 to 84GW in 2030.
According to the current hardware cost, the investment in each GW of AI data center requires at least 40 billion US dollars (if the latest generation platform Vera Rubin is adopted, the upper limit of investment per GW can reach 47-500 billion US dollars). For a scale of 80GW in 2030, it implies that the total investment in AI infrastructure by then may reach 3-4 trillion US dollars.
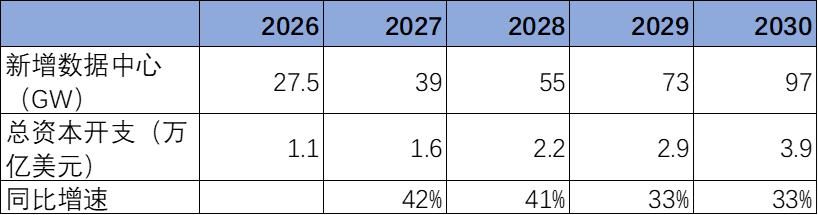
Table: Scale of capital expenditure corresponding to AI construction volume under high expectations Source: Jindu Institute summary
But problems also arise: can long-term revenue justify the rationality of this massive investment? Has the current capital expenditure intensity touched the reasonable boundary? If the previous discussion holds, where will this money come from? This article attempts to measure the rational ceiling of AI investment from a neutral and objective perspective.
01
Preface: Four leaps of demand expansion and anchoring of total rationality
To understand the space for capital expenditure, we must first understand the underlying logic why AI demand can expand. Since the end of 2022, large AI models have experienced four clear paradigm leaps:
○ The first round is the Q&A era opened by text-to-text, which brings the expansion of user breadth;
○ The second round is the complement of context capability and visual capability, which brings the expansion of data capacity;
○ The third round is the era of reasoning and chain of thought, which brings the expansion of depth of information volume;
○ The fourth round currently underway is the Agent era, where large models can complete extremely complex tasks.
The end point of every leap is the same result: Token usage increases significantly, and the boundary of AI's ability to solve problems expands greatly. The direct result of the demand explosion is the continuous tension and overall price increase of the supply chain, and finally the capital expenditure of cloud manufacturers is continuously revised upwards.
Especially since 2026, the accelerated implementation of the fourth paradigm has made "working Agent" move from concept to reality, and the speed at which core enterprise workflows are penetrated by AI has increased significantly.
According to data from the U.S. Census Bureau, the AI penetration rate of U.S. enterprises has risen rapidly from less than 5% at the end of 2023 to about 20% in mid-2026. Obviously, AI has become a heavyweight technological revolution that occurs once in decades.
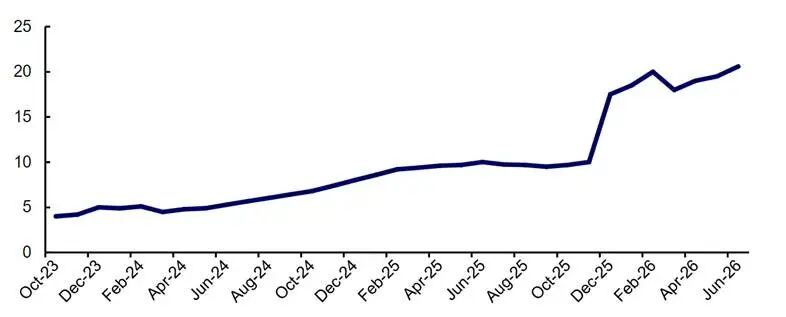
Figure: AI penetration rate of U.S. enterprises Source: U.S. Census Bureau, CITIC Securities
At the macro scale, is this magnitude of AI investment reasonable?
The current global total GDP is about 118 trillion US dollars, and AI investment in 2026 is about 1 trillion US dollars, accounting for less than 1% of the total global GDP. Assuming that the global GDP reaches 130 trillion US dollars in 2030, of which IT expenditure accounts for 3% (the US's IT expenditure already accounted for 6% of GDP before), and half of the IT expenditure goes to AI, then AI capital expenditure can be calculated as 4 trillion US dollars.
Since this round is led by North American investment, another perspective is to only look at the investment intensity of the United States. The US GDP is 38 trillion US dollars, and the current AI capital expenditure accounts for about 2% of GDP. Referring to the historical infrastructure cycle — the highest railway investment in the UK reached about 6% of GDP, and the US railway investment reached 3-4% of GDP — there is still significant more than doubling room for AI investment proportion.
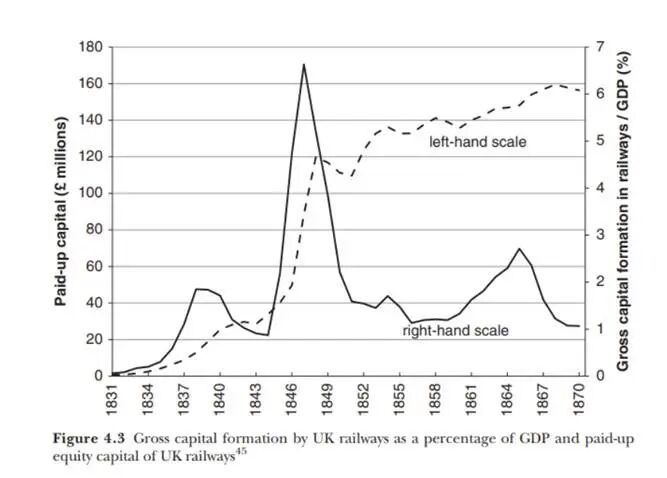
Figure: During the UK railway bubble period, capital expenditure once reached 6-7% of GDP Source: Huatai Research
These measurements all point to a conclusion: from the macro total perspective, 3-4 trillion US dollars of AI capital expenditure is not a completely infeasible assumption.
But "feasible" at the macro level does not equal "realizable" at the micro level.
02
What is the revenue visibility? 3 trillion is confirmed and 7 trillion is to be determined
Investment ultimately needs revenue to support it.
According to the historical experience law, it can be assumed that the capital expenditure intensity (Capex/Revenue) of the AI industry at the peak period is 35%, then 3-4 trillion US dollars of capital expenditure implies that the AI industry needs to achieve an annualized revenue of 8-10 trillion US dollars.
What concept is this? We can make a simple comparative analysis:
○ In 2025, the total revenue of North American Mag 7 is about 2.2 trillion US dollars, and 8-10 trillion US dollars is equivalent to recreating nearly 5 new Mag 7.
○ If expanded to the S&P 500, its total operating revenue in 2025 is about 19 trillion US dollars, and AI is equivalent to recreating at least half of the S&P 500.
○ For nearly 10 trillion US dollars in revenue, if 50% of the revenue can be converted into GDP like other information technology industries, then we estimate that the proportion of AI industry in global GDP in 2030 will be about 3-6%, which is equivalent to recreating the automobile and pharmaceutical industries combined. AI needs to cover the path of two century-old industries in 10 years.
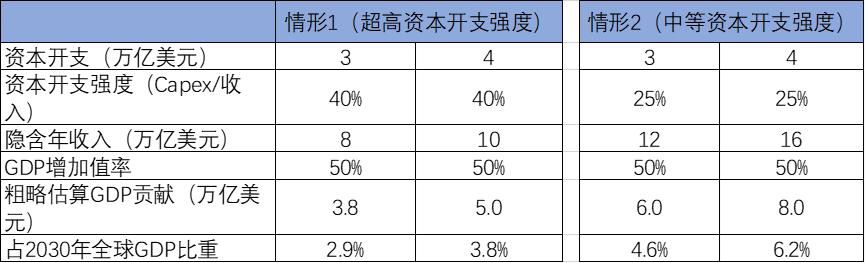
Table: Proportion of AI industry in GDP Source: Jindu Institute estimation
How much of such a huge revenue volume expectation is "visible" at present? From the currently proven business models, there are mainly three paths.
The first is cloud (API) services.
This is the track with the clearest path and the most certain realization at present, that is, AI greatly enhances the motivation of enterprises to go to the cloud and the upper limit of payment. About 70% to 80% of Anthropic's revenue comes from API calls, which also confirms the core position of cloud-side monetization.
Estimates of AI-related revenue increments of major North American cloud manufacturers from 2026 to 2030 show that Amazon is expected to grow by about 200 billion US dollars, Google by about 300 billion US dollars, Microsoft by about 200 billion US dollars, plus other new cloud manufacturers by about 200 billion US dollars, corresponding to a total revenue space of about 900 billion US dollars, that is, a trillion-dollar track.
The second is personal subscription (To C).
Represented by OpenAI, Anthropic and others in the US market, the C-end has generally established an "AI tax" threshold starting at 20 US dollars per month.
If the number of global C-end paying users reaches 2 billion, the basic subscription alone corresponds to about 500 billion US dollars; superimposed with additional services such as advertising, a total C-end space of about 1 trillion US dollars is not wishful thinking. But the uncertainty of this track lies in users' willingness to pay, retention rate, and the difference in payment capacity in different regions.
The third is programming (Coding).
This is the vertical track with the highest attention and the most certain monetization at present. The core reason why the Coding track is easier to monetize is that the users are high-paid knowledge workers, the tools are deeply embedded in the development process, the paying entity is the enterprise R&D budget rather than individual consumers, and the results are quantifiable.
There are about 50 million programmers in the world with an average annual salary of about 50,000 US dollars. If 40% of the work is replaced or enhanced by AI, it corresponds to a market space of about 1 trillion US dollars.
The three tracks of cloud services, C-end and coding add up to roughly correspond to 3 trillion US dollars of foreseeable revenue. This is the part with the highest market consensus and clear data support at present. But there is still a gap of about 7 trillion US dollars from the 10 trillion US dollar target, and it is not clear at present which scenarios this gap needs to grow from.
Third-party research cannot calculate a higher number either.
Bloomberg Intelligence revised the long-term generative AI market size from 1.8 trillion US dollars to 2.3 trillion US dollars in 2026, and gave a detailed revenue split for 2032: nearly 600 billion US dollars for infrastructure, 730 billion US dollars for equipment and applications (inference), 191.9 billion US dollars for inference/fine-tuning cloud workloads, 120 billion US dollars for LLM licensing revenue, 310 billion US dollars for chatbots/AI Agents, 210 billion US dollars for customer service/contract review AI Agents, 210 billion US dollars for generative AI-driven advertising expenditure, 80 billion US dollars for IT services, and 80 billion US dollars for workload monitoring software.
HSBC predicts that the global AI industry revenue will reach 920 billion US dollars in 2030, of which B2B accounts for 708 billion; Jefferies estimates that the global enterprise AI TAM excluding China will be 1.4 trillion US dollars in 2030.
More critically, from the current penetration rate in the United States, employees in high-tech industries such as information services, financial insurance, technical services, and enterprise management have the highest proportion of using generative AI, all exceeding 60%; while the penetration rate of more traditional industries such as public administration, entertainment and leisure, accommodation and catering, and transportation is less than 30%.
According to Anthropic's research, for industries such as management, business and finance, computer and mathematics, the theoretical penetration rate of AI can exceed 80%; but for industries such as production, manufacturing and maintenance, agriculture, the theoretical penetration rate is less than 20%.
This means that if AI wants to find a new trillion-dollar track, it must continue to dig deep in high-tech industries and break through the penetration bottleneck of traditional industries at the same time — and the latter obviously faces greater challenges in the short term.
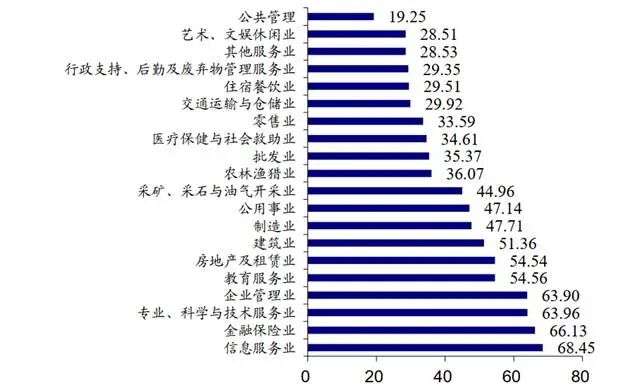
Figure: Proportion of employees using AI in various industries in the US Source: Guotai Haitong Securities
03
Stones from other mountains: what are the historical reference frames for capital expenditure intensity?
Since there is huge uncertainty in both total volume and revenue, from a financial perspective, how to judge whether the current capital expenditure intensity of cloud manufacturers is reasonable?
To judge whether the current AI capital expenditure is reasonable, we should not only look at the absolute value, but also the relative level of capital expenditure intensity (Capex / Revenue). By benchmarking different types of heavy asset industries, we can more clearly locate the current cycle stage of AI.
Historically, industries with high capital expenditure intensity can be roughly divided into two categories:
The first category is "heavy asset network industries", typically such as railways, power grids, and telecommunications operators. Their common feature is that investment comes before revenue, and after the network coverage enters the mature stage, the capital expenditure intensity falls, and the improvement of free cash flow and profit margin begins to be realized.
Telecom is a typical case: during the peak period of 5G and computing network investment from 2021 to 2023, the Capex/Revenue of China's three major operators reached 20%-24%, and fell below 18% in recent years; after peaking at about 20% in 2021/2022, the European telecom industry gradually fell back to within about 15% in 2026.
The intensity of power grid is slightly lower. Taking China as an example, the total annual revenue of State Grid and China Southern Power Grid is about 5 trillion yuan, and the capital expenditure is about 750 billion yuan, with capex/revenue of about 15%. The basically anchored intensity of these tracks is 15%-25%, which is difficult to go further higher.
The second category is "technology iteration-driven industries", which always maintain high investment intensity, typically such as semiconductor foundry, cloud computing, lithium battery, and storage.
Their investment peak may appear when demand is extremely strong, capacity utilization is high, and product generations are leading, showing a state of "high Capex intensity + high profit margin" coexisting. TSMC is the most extreme case: in the latest peak of capital expenditure intensity from 2021 to 2022, Capex/Revenue reached about 50%, but the operating profit margin was still nearly 50%; after the capital intensity fell back to about 33% from 2024 to 2025, the profit margin continued to rise.
The historical data of AWS is also typical: the capital intensity was roughly between 27% and 33% from 2018 to 2023, and after entering the AI investment period, the capital intensity even rose to more than 40%.
CATL in the lithium battery industry also has certain reference significance. When its products are leading, its capital expenditure increases sharply, and Capex/Revenue reached a high level of 26.4%-33.6% from 2020 to 2022, then fell rapidly accompanied by positive cash flow and rapid improvement of profitability.
Storage manufacturers (SK Hynix, Micron) are the most cyclical among these high-tech products, but their average investment intensity is around 30%.