Measuring AI transformation via financial statements
All enterprises are talking about AI applications, but only a few can deliver on AI's value
Based on the Hedging Resilience Index (HRI) framework, iResearch conducted measurement and research on the 2026 H1 financial report data of 204 listed company samples. Calculated based on public financial report data, this index aims to measure whether enterprises can translate AI into revenue and operational resilience. The data shows that the average HRI score of sample enterprises is 47.88, and the AI value increment of more than half of the enterprises cannot yet hedge the impact of AI on their original businesses.
Adoption Has Been Widespread, Value Delivery Remains Limited to a Minority
The adoption of AI in enterprise operation and production has expanded from the attempts of early adopters to a universal behavior. iResearch survey shows that in Q1 2026, the adoption rate of new-generation AI among large and medium-sized enterprises in China is about 81.3%, a roughly 4-fold increase compared with 2023 (about 20.7%). Most enterprises are still in the exploration stage of implementing agent applications, but accelerating the embrace of the new-generation AI centered on large models has become a clear trend.
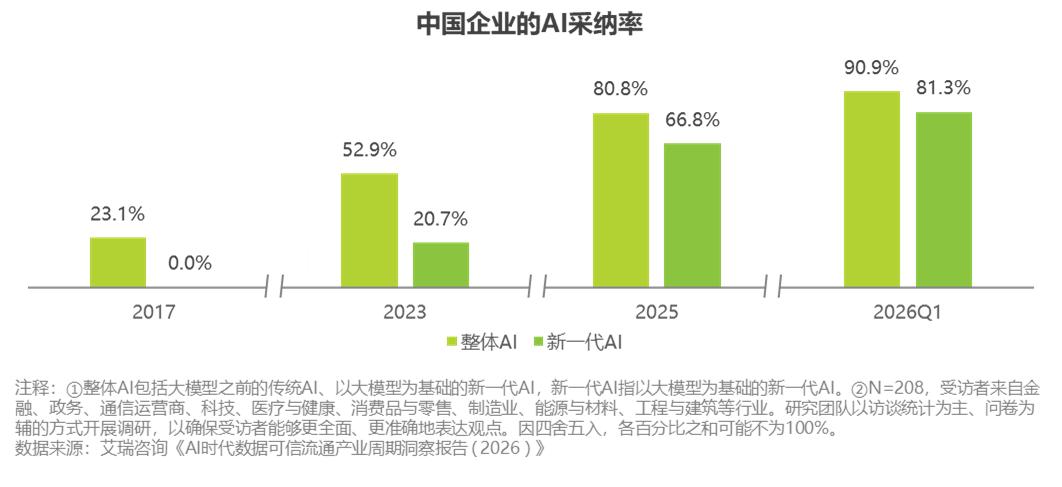
Adoption no longer differentiates enterprises, and the gap lies in the value delivery stage. Over the past two years, almost every listed company has talked about AI in its annual reports and performance meetings, covering self-developed large models, agent implementation, computing power layout, and industry-specific solutions. There are numerous narratives around AI, but performance delivery lags relatively behind. Although individual efficiency has generally improved due to AI applications, the profit improvement at the enterprise level has stagnated. iResearch estimates that about 30% to 40% of enterprise-level agent projects will stagnate or shut down within 18 months due to unmet ROI expectations, with a coexistence of mass project launches and mass project failures.
There are already abundant AI narratives in the market, but there is a lack of a measuring scale for value delivery. The self-developed Hedging Resilience Index (HRI) by iResearch is calculated based on public financial report data to judge whether enterprises have truly translated AI capabilities into revenue and resilience. In this report, we analyze the 2026 H1 financial report data of 204 sample enterprises based on the HRI framework, and find that for more than half of the enterprises, the value increment brought by AI cannot yet hedge the impact of AI on their original businesses.
Average HRI Score Reaches 47.88, More Than Half of Enterprises Have Not Yet Broken Through the Critical Inflection Point of AI Transformation
The Hedging Resilience Index (HRI) measures whether, when an enterprise's original business is under pressure, its AI-related revenue can fill the gap, sustain growth, and translate market expectations into sustainable operational resilience. Based on the financial reports of listed companies, official disclosure documents and industry benchmark data, the HRI translates enterprises' AI transformation status into calculable, trackable, and horizontally comparable coordinates through seven core indicators, four major transformation paradigms and practical AI business discrimination.
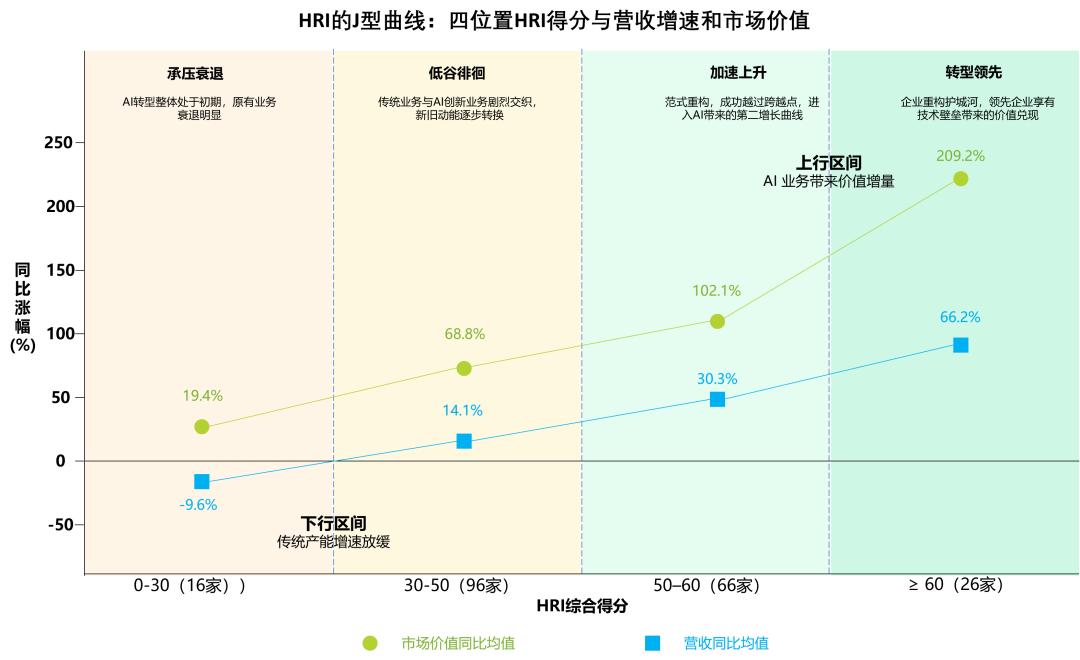
The J-curve is an important tool for the HRI to evaluate enterprises' AI transformation status. With the decline of traditional businesses and the development of new AI businesses, the transformation value of enterprises presents a trajectory of first declining and then rebounding. When the growth of traditional businesses is under pressure and new AI businesses have not yet taken over, enterprises are in the pressure-decline period (0-30 points); when the pressure of the alternation between old and new businesses reaches its peak, enterprises enter the trough lingering period with the highest transformation cost (30-50 points); only when the increment of new AI revenue for the first time makes up for and exceeds the decrement of traditional business, can enterprises cross the critical node, enter the accelerated rising period (50-60 points), and further move towards transformation leadership (above 60 points).
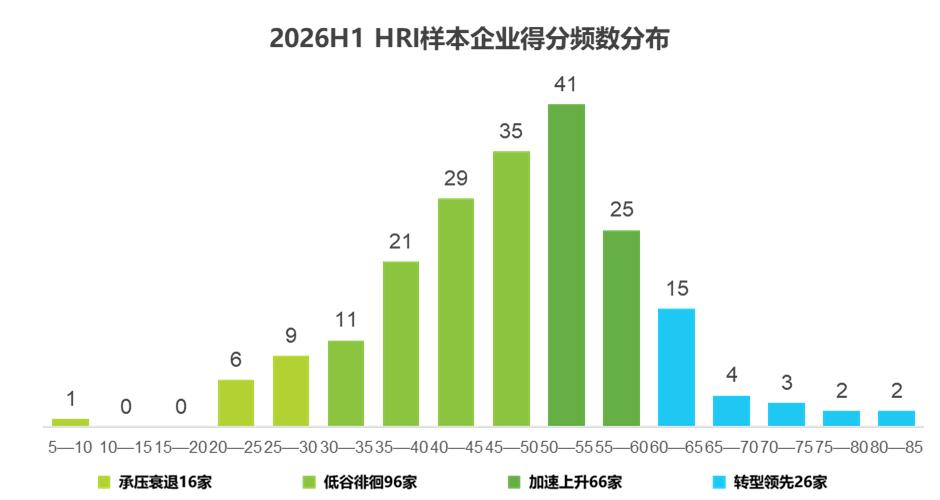
Among the 204 sample enterprises, nearly half are lingering in the trough, more than half are still on the left side of the J-curve inflection point, and the whole group is at the threshold of crossing the inflection point. Specifically, the average HRI score of sample enterprises is 47.88, and the median is 48.42, both below the critical inflection point of 50 points. A total of 112 enterprises (accounting for about 54.9%) have not crossed the 50-point threshold, of which 96 (47.06%) fall in the trough lingering range, and only 26 (12.75%) have entered the transformation leadership stage. That means, by the mid-2026 of this round of AI transformation, most enterprises are still staying at the inflection point in the middle section of the J-curve.
Every time an enterprise moves up a score tier on the HRI J-curve, its revenue growth rate and growth quality shift gears synchronously. The average year-on-year revenue growth of the four tiers in 2026H1 are as follows: -10.3% for pressure-decline, 14.4% for trough lingering, 33.9% for accelerated rising, and 68.9% for transformation leadership, with a gap of 79.2 percentage points between the first and the last tier. The pressure-decline stage represents an overall decline in value, the trough lingering stage represents moderate growth, the accelerated rising stage represents double-digit growth driven by AI, and the transformation leadership stage represents high growth after AI revenue fully takes over. Among the 28 enterprises with revenue growth rate exceeding 50%, 24 fall into the accelerated rising and transformation leadership tiers.
Differentiation Mainly Occurs Within Industries, Four Paradigms Have Their Own Shortcomings
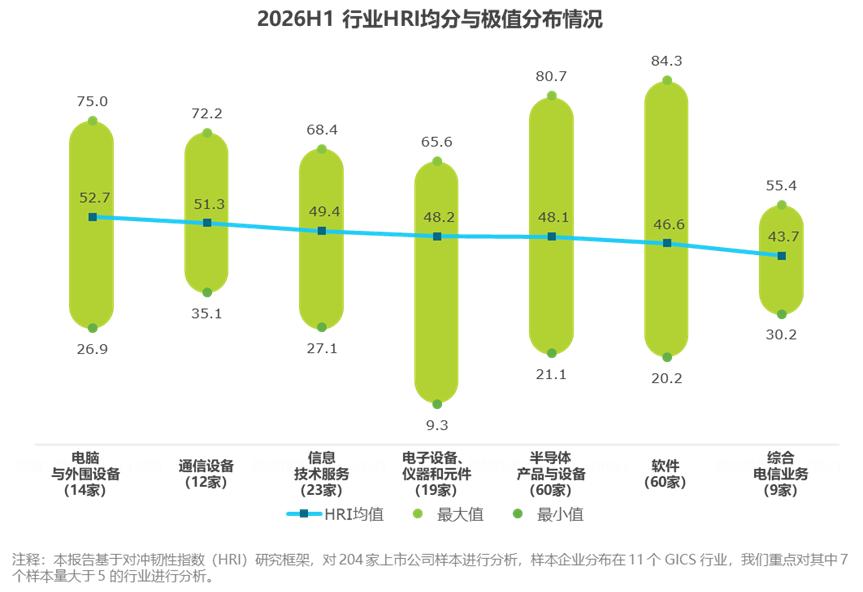
There are gradient differences in AI transformation resilience between industries but the gap is limited, and the differentiation of AI transformation resilience among enterprises within the same industry is far greater than the gap between industries. The average HRI score of the seven industries ranges from the highest 52.7 to the lowest 43.7, with a range of about 9 points. Within the same industry, the average HRI range is about 47.4, and the average interquartile range is about 13.6, so the intra-industry differentiation is nearly 5 times that of inter-industry differentiation. All seven industries, without exception, contain both enterprises that have crossed the critical node of AI transformation and those that have not. No industry as a whole is leading or lagging behind completely, and enterprises in every industry have the opportunity to outperform this round of AI transformation with high resilience.
To further explain the gaps between enterprises, the HRI research framework divides enterprises into four paradigms based on two dimensions: the growth rate of AI revenue and whether the basic business is declining. The type with simultaneous growth of new and old businesses is the Dual-growth Leading type; the type with declining old business that is supplemented by rapid growth of AI revenue is the Compensation Transition type; the type with stable old business and relatively slow AI revenue growth is the Steady Accumulation type; the type with weak performance in both new and old businesses is the Dual-weakness Pressure-bearing type.
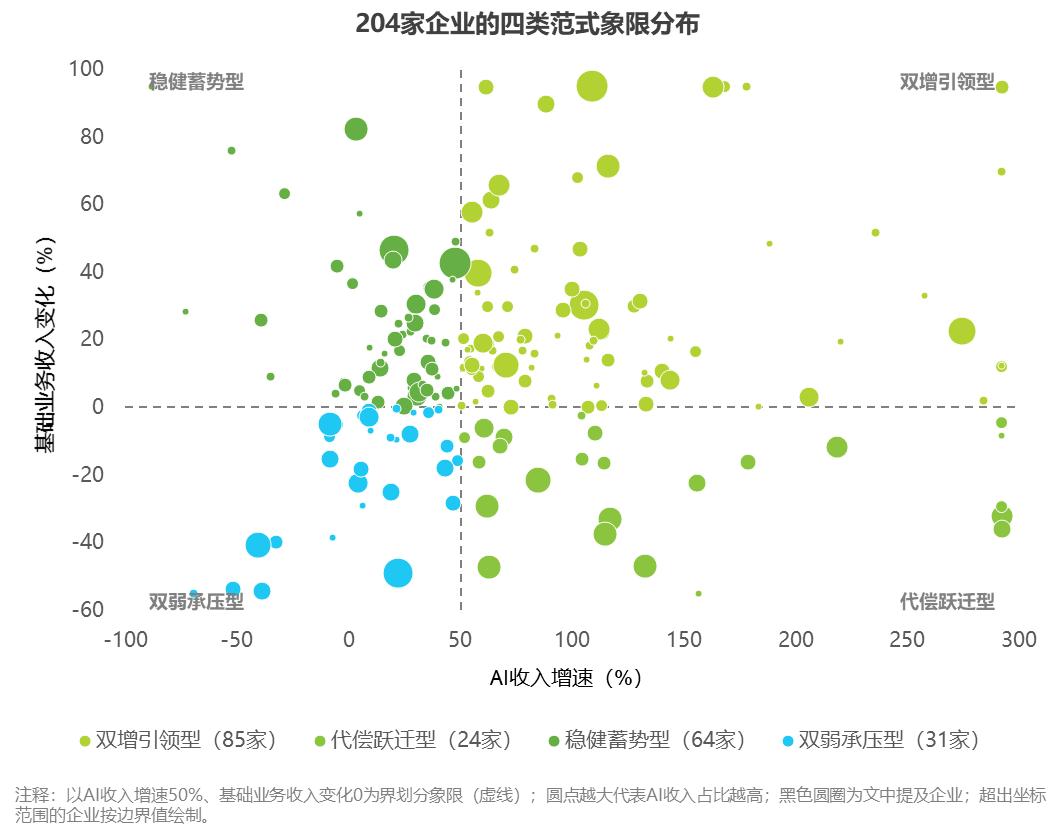
There are 85 Dual-growth Leading enterprises, accounting for 41.7%, with an average HRI score of 52.06, mainly computing power hardware enterprises. This type of enterprises has relatively fast growth but insufficient revenue locking, and their performance is greatly affected by the capital expenditure rhythm of downstream customers; it is recommended to convert short-term orders into multi-year agreements and increase the proportion of AI revenue.
There are 24 Compensation Transition enterprises, accounting for 11.8%, with an average HRI score of 52.30, which is mostly the transformation path of operators and equipment vendors. Their AI grows fast, but their future value and adjustable time are already close to the Dual-weakness Pressure-bearing type; it is recommended to make the new AI revenue stably cover the gap of old businesses and convert it into free cash flow as soon as possible.
There are 64 Steady Accumulation enterprises, accounting for 31.4%, with an average HRI score of 45.09, mainly software and semiconductor subscription-based enterprises. This type has the best contract protection among the four categories, but the median AI revenue growth rate is 27% and the median proportion of AI revenue is 13%, and three-quarters of them are still at the bottom of the J-curve; it is recommended to turn AI into separately priced, renewable products during the contract period.
There are 31 Dual-weakness Pressure-bearing enterprises, accounting for 15.2%, with an average HRI score of 38.75, mainly A-share software enterprises. The median proportion of AI revenue of this type is 22.6%, which is not low, but the growth rate is less than 9%, 10 of them are in negative growth, and the basic business is shrinking at the same time, with the shortest adjustable window among the four categories; it is recommended to stop the decline of AI revenue first, and concentrate resources on a small number of products that customers are willing to pay for.
Three Actions to Improve AI Transformation Resilience
The shortcomings of the four types of enterprises point to different directions, and the paths to improve resilience are also different. Through observation of transformation-leading enterprises, we believe that three major measures can continuously improve enterprises' AI transformation resilience:
First, turn AI into products with independent commercial value to form measurable AI value. Take Palantir as an example, its AIP platform integrates large model access, AI development toolchains, AI applications and production governance framework into a whole; in contrast, products that only stay at the point-type AI auxiliary function lack independent bargaining power.
Second, use subscription systems and long-term contracts to lock in future revenue. Innodata's Agility business is mainly sold through subscription agreements, ASML holds multi-year advanced process and equipment orders, and Broadcom's custom chips are bound to multi-year foundry agreements with hyperscale manufacturers; in contrast, one-off projects and short-term spot orders will make revenue fluctuate with downstream orders, increasing the uncertainty of revenue and cash flow.
Third, continuously track the coverage rate of new AI revenue to the gap of old businesses, and take it as an annual/quarterly operating indicator for tracking. By keeping an eye on the gap, enterprises can reserve adjustment time before the growth rate drops or the contract expires.
Conclusion
AI transformation has brought a lot of discussions, but the value delivered in financial reports is still weak. iResearch's HRI takes financial reports as the measuring scale, translates public enterprise data into comparable coordinates, and answers a core question: who has truly turned AI into revenue and resilience, and who still stays at the narrative level. The average HRI score of the 204 samples is 47.88, the center of gravity falls in the trough lingering range, more than half of the enterprises are still below the 50-point threshold, and the AI transformation of the vast majority of enterprises is still in the early climbing stage. Enterprise operators can use HRI to locate their own stage, identify weak links and benchmark against industry leaders, so as to determine the priority of transformation and resource allocation direction.
Legal Statement
The information in this report comes from publicly available materials that we consider reliable, but iResearch and its affiliates (hereinafter collectively referred to as "the Company") do not make any guarantee for the authenticity, accuracy and completeness of such information, nor do they guarantee that the information and suggestions contained will not be changed. The financial data cited in the report shall be subject to the official public disclosure of the enterprise; in case of any difference with the actual disclosed content, the official document of the enterprise shall prevail. The Company has no obligation to update the changed information and suggestions to all recipients of this report.
This report only reflects the views and judgments of the author on the issuance date, which are analytical judgments based on current information and have uncertainties. This report is not a securities research report, does not constitute a securities investment analysis report, securities investment analysis suggestions or any securities investment consulting services, nor does it constitute investment analysis, valuation, rating, trading recommendations or investment decision-making basis for any financial products such as securities, funds and bonds. Investors shall make independent evaluation of the information and opinions in this report, and take into account their respective investment purposes, financial status and specific needs. The Company and/or its affiliates shall not bear any legal liability for all consequences caused by relying on or using this report.
The HRI score reflects the quantitative analysis result as of the data date, and does not represent a comprehensive business evaluation or credit rating of any enterprise. The HRI score of the same enterprise may change due to data updates.
The descriptions, classifications, scores, examples or other expressions of enterprises involved in this report are all quantitative analysis or neutral explanations made based on public information as of the data date and the established analysis framework, and do not constitute subjective evaluation, business evaluation, reputation evaluation, derogatory judgment, accusation or any form of infringement on any enterprise. The enterprise names, trademarks, logos, etc. mentioned in the report are only for identification, explanation and analysis purposes, and the relevant rights belong to their right holders.
The copyright of this report belongs to the Company. Without prior written authorization from the Company, no institution or individual may copy, cite, publish or disseminate all or part of the content of this report in any form. When publishing and forwarding this report or its abstract with authorization, the publisher shall indicate the publisher and release date of this report, and prompt the risks of using this report. Those who copy, cite, publish or disseminate this report without authorization or in accordance with relevant requirements shall bear corresponding legal responsibilities. The Company reserves the right to pursue legal responsibilities against them.
This article is from the WeChat Official Account "iResearch" (ID: iresearch-), author: iResearch, 36Kr is authorized to release it.