The low-total-price segment of Beijing's second-hand property market is ebbing.
In the third quarter, subtle changes have emerged in Beijing's second-hand residential property market.
First, low-total-price housing units that underpinned the transaction volume over the past three years have for the first time seen a clear retreat. At the same time, housing units with a total price of over 7 million yuan have expanded against the trend.
Second, the listing volume stopped falling and rebounded for the first time in September after seven consecutive months of decline.
This means that the single pattern of "solely supported by rigid demand" during the "mini spring peak" has changed in the third quarter.
01
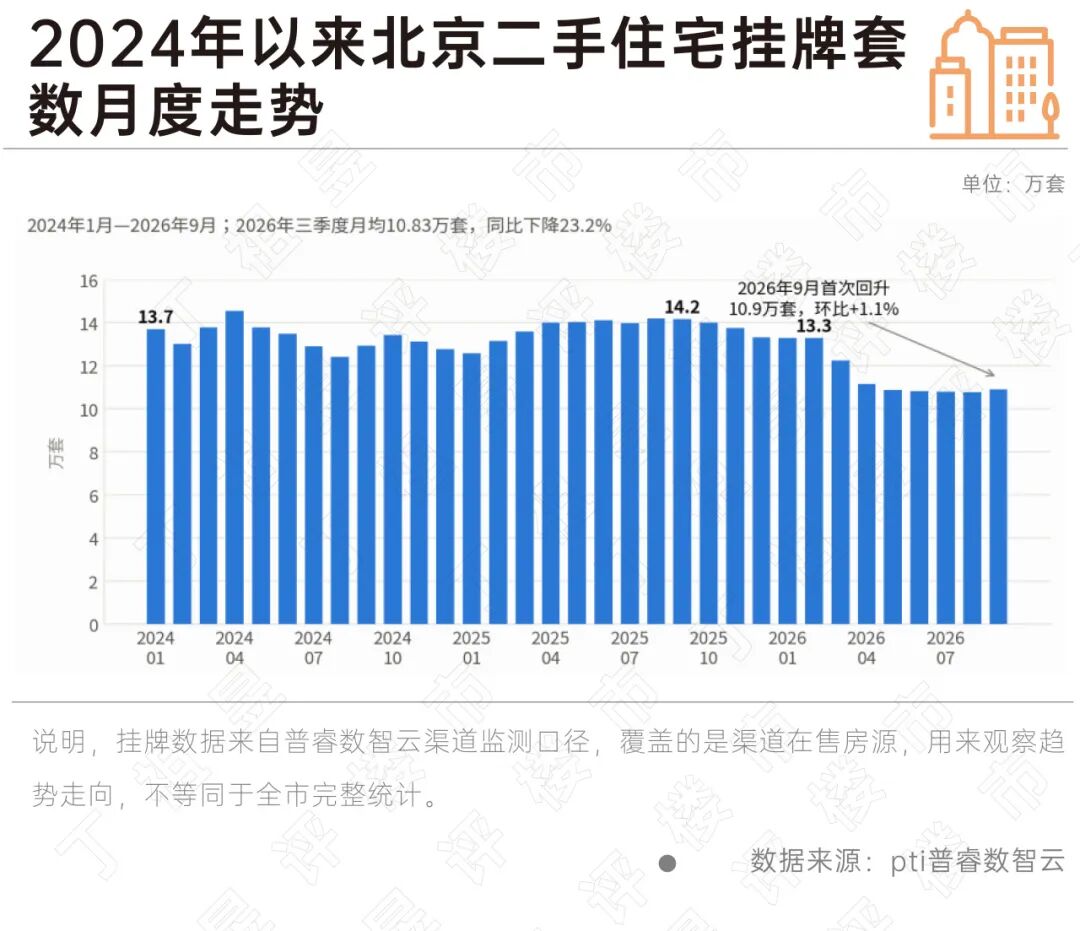
The average monthly number of listed second-hand residential properties in Beijing in the third quarter was 108,300, nearly a quarter less than the same period last year, with a decline of 23.2%. What is more noteworthy is the trend: the listing volume dropped continuously for seven months from 132,900 units in February this year, leaving only 107,800 units in August, with a cumulative decrease of 25,100 units. It was not until September that the listing volume rebounded to 109,100 units, a 1.1% month-on-month increase, marking the first monthly stop of decline since 2026.
In terms of transactions, 41,525 second-hand residential units were traded in the third quarter, a year-on-year increase of 3.7%, only down 11.9% month-on-month. This decline is not difficult to understand: the 47,154 units in the second quarter were the highest point in the seven quarters since 2025, and the decline in the third quarter is more of a correction to the concentrated release in the second quarter. Compared with last year, transactions still recorded positive growth, which is also higher than the 40,000-unit level in the fourth quarter of 2025 and the first quarter of this year.
Fewer listings and no collapse in transactions mean that the low-price housing units that have been suppressed in the past two years are being bought up, while the supply of newly listed units, especially low-price units, is decreasing.
02
Judging from transaction prices and average listing prices, the bargaining power of buyers has not loosened at all.
In the third quarter, the average transaction price of second-hand residential properties in Beijing was 41,310 yuan per square meter, down 11.8% year-on-year and 3.5% month-on-month; the average listing price was 51,484 yuan per square meter, down 8.5% year-on-year and 1.9% month-on-month. In comparison, the year-on-year decline in transaction prices is 3.3 percentage points higher than that of listing prices, indicating that price cuts on the listing side have hit the brakes, while concessions on the transaction side are still continuing.
The price gap tells this most straightforwardly. The difference between the average listing price and the average transaction price was 9,692 yuan in the second quarter of this year, which widened to 10,174 yuan in the third quarter, and the single-month figure in September surged to 10,930 yuan, the second highest level since 2024. The corresponding discount rate, that is, the average transaction price divided by the average listing price, dropped from 83.3% in the third quarter of 2025 to 80.2%, and was only 78.6% in the single month of September.
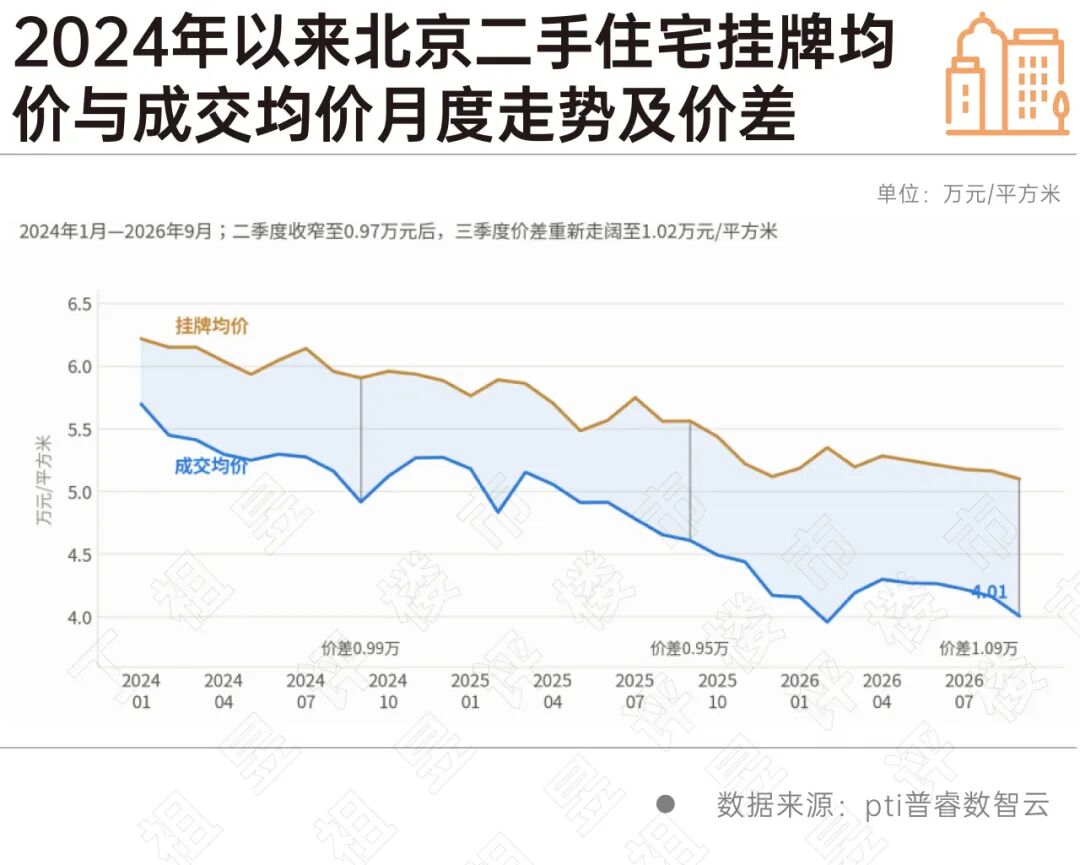
This is exactly the opposite of the trend during this year's mini spring peak. Back then, listing prices were accelerating downward and actively moving closer to transaction prices, the price gap was narrowing, and sellers were eager to sell; in the third quarter, the decline in listing prices slowed down while transaction prices continued to fall, and the price gap widened again. Coupled with the fact that the listing volume is nearly a quarter less year-on-year, it can basically be judged that sellers' price concessions are almost reaching their psychological bottom line, and what can further push down transaction prices next is buyers' bargaining, with the initiative firmly on the buyers' side.
The structure of existing listed housing units also confirms this. Among the listed housing units priced below 3 million yuan in the third quarter, the average total price per unit rose from 1.808 million yuan in the same period last year to 1.938 million yuan, an increase of 7.2%; while for the 10 million to 30 million yuan tier, the average total price per unit dropped from 15.519 million yuan to 14.999 million yuan, a decrease of 3.3%. High-total-price housing units are lowering their prices and sinking into the low-total-price listing pool, resulting in larger floor areas and better quality houses within the same total price range. This precisely explains why the unit price in the low total price segment is still falling.
03
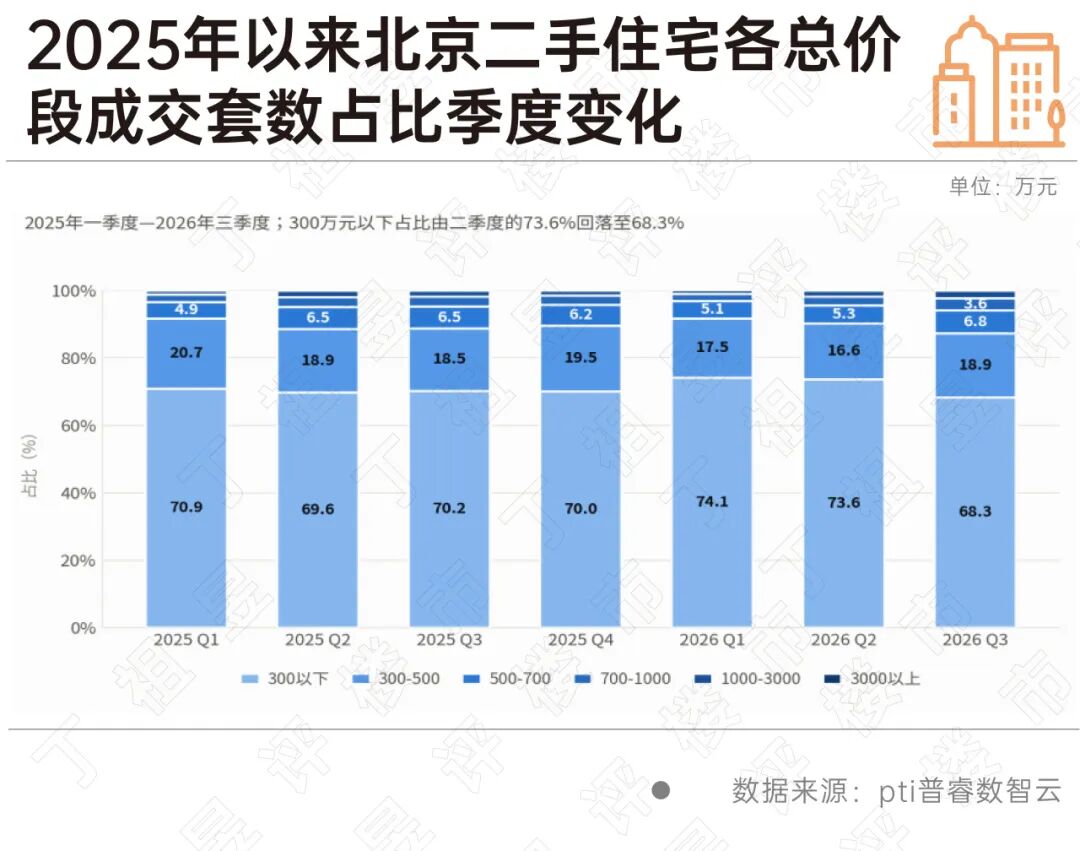
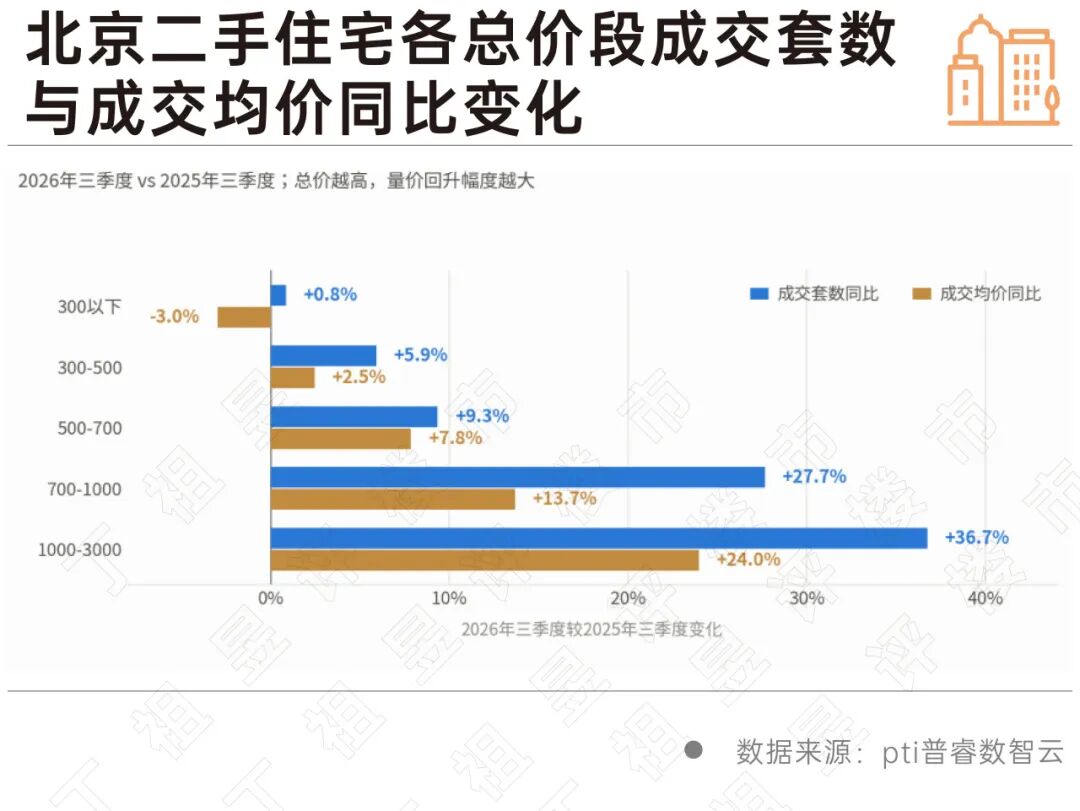
What really makes this quarter a turning point is the transaction structure. The transaction proportion of housing units with a total price below 3 million yuan dropped from 73.6% in the second quarter to 68.3%, down 5.3 percentage points month-on-month and 1.9 percentage points year-on-year, breaking the pattern that had remained stable at around 70% for six consecutive quarters. Looking at the number of units alone, 28,349 units were traded in this tier in the third quarter, down 18.3% month-on-month but still a slight increase of 0.8% year-on-year.
On the other hand, the medium and high total price segments are all moving upward. 2,832 units were traded in the 5 million to 7 million yuan tier, up 9.3% year-on-year; 1,477 units were traded in the 7 million to 10 million yuan tier, up 27.7%; 1,001 units were traded in the 10 million to 30 million yuan tier, up 36.7%. The proportions of the three tiers rose to 6.8%, 3.6% and 2.4% respectively, totaling 12.8%, 1.6 percentage points higher than the same period in 2025. The total transaction volume of the whole city only increased by 3.7%, and almost all the increment came from units priced above 7 million yuan.
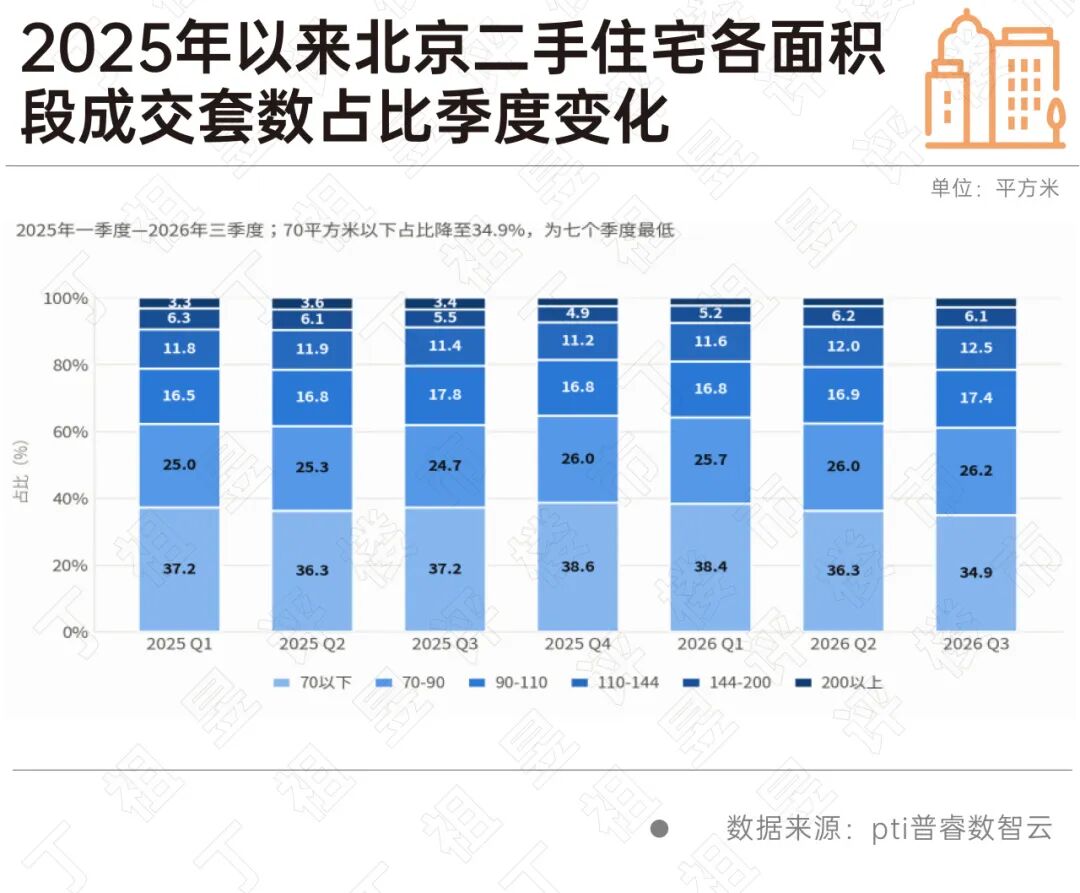
The floor area segments point to the same direction. The transaction proportion of housing units under 70 square meters dropped to 34.9%, the lowest in seven quarters, 1.4 percentage points lower than the second quarter and 3.7 percentage points lower than the peak in the fourth quarter of 2025; the total proportion of units over 110 square meters returned to 21.5%, matching the level in the first half of 2025. In terms of year-on-year unit change, units of 70 to 90 square meters increased by 10.0%, units of 110 to 144 square meters increased by 13.8%, units of 160 to 180 square meters increased by 24.8%, while units under 70 square meters decreased by 2.7%, and units over 200 square meters decreased by 13.7%. The expanding segment is the "mid-range floor area".
04
The performance of segmented prices also shows that improved housing demand is returning: the higher the total price, the sharper the unit price rises. The average transaction price of the 10 million to 30 million yuan tier rose from 56,002 yuan per square meter to 69,420 yuan, up 24.0% year-on-year; the 7 million to 10 million yuan tier rose by 13.7%; the 5 million to 7 million yuan tier rose by 7.8%; the 3 million to 5 million yuan tier rose by 2.5%; only the tier below 3 million yuan fell by 3.0%, which is the only declining tier.
The average transaction price of the whole city fell by 11.8% year-on-year, coexisting with the general rise in medium and high total price tiers. In the final analysis, the decline in the city-wide average price mainly comes from the tier below 3 million yuan, which accounts for nearly 70% of the total and is the only tier with a falling unit price.
Therefore, the third quarter is a structural turning point for Beijing's second-hand housing market.
In terms of volume, transactions still recorded positive year-on-year growth, while the listing volume was nearly a quarter less year-on-year, marking the end of the passive clearance on the supply side;
In terms of price, the decline in transaction prices continued to outpace that of listing prices, the price gap widened again, and the discount rate dropped to 80.2%, with bargaining initiative still on the buyer's side;
In terms of structure, low-total-price housing units that have underpinned transactions for nearly three years have for the first time seen an obvious retreat, transactions of units priced above 7 million yuan rose by 20% to 30% year-on-year, and improved housing demand has begun to enter the market substantially. The single pattern of rigid demand being the sole support during the mini spring peak has been rewritten in the third quarter.
For the fourth quarter, we have three judgments.
First, the transaction volume will most likely remain at around 40,000 units. Listings in September have stopped falling and rebounded, available housing units are replenished again, and with prices still in a downward channel, the transaction scale is supported.
Second, the recovery of improved and high-end housing demand will continue. High-total-price housing units on the listing side are continuing to cut prices and sink to lower tiers, and the cost-effectiveness of units priced above 7 million yuan is passively improving, which is the direct source of the increment in the third quarter and will still hold true in the fourth quarter.
Third, the city-wide average transaction price is still difficult to stabilize. The tier below 3 million yuan accounts for nearly 70% of the total and is the only tier with a falling unit price. As long as the structural weight of this tier does not decrease significantly, it will be difficult for the year-on-year decline of the city-wide average price to narrow obviously. Exchanging price for volume will still be the main tone for Beijing's second-hand housing market to maintain its transaction scale.
This article is from the WeChat Official Account "Ding Zuyu Comments on the Real Estate Market", authored by the Editorial Department & Prism Research, and published with authorization from 36Kr.