A survey covering more than 200 LPs
What have LPs been doing over the past year? The answer is documented in a first-hand survey covering more than 200 institutional LPs.
After a round of in-depth adjustment, the primary market in 2026 has shown a trend of "sunlight breaking through the clouds".
In the first half of the year, market sentiment rose rapidly, transactions in the hard technology track exploded intensively, competition for high-quality projects intensified, the vitality of the fundraising side was significantly released, the willingness of institutional LPs to contribute capital rebounded markedly, and the rhythm of capital contribution decisions accelerated greatly, changing the state of widespread wait-and-see and lengthy decision-making cycles in the past two years.
As the market heated up rapidly, valuations in popular tracks rose, and divergences gradually accumulated in the market, with a prominent K-shaped differentiation. Entering the second half of the year, the heat has cooled down, and capital contributors have shifted from "snatching projects" to prudent screening, bringing the market back to rationality. Even so, the overall activity level for the whole year is still significantly higher than that of the previous two years, and the industry is at a critical window of recovering from the bottom and transitioning to a new cycle.
This round of recovery is not the extensive capital carnival of the old cycle, but a reconstruction of capital structure and decision-making logic. State-owned capital and fiscal funds continue to act as the ballast stone of the market, industrial groups and listed companies continue to enter the market as incremental LPs, tools such as sci-tech innovation bonds and private placement bonds further broaden capital sources, and the investable capital pool of institutional LPs continues to expand. LPs are speeding up their moves, and their willingness to deploy capital has increased significantly; but amid the ups and downs of the market, capital contributors have also established a more mature risk benchmark, increasing allocation while seizing the recovery window, and putting forward higher requirements for underlying asset quality, GPs' ability to traverse cycles, and the effectiveness of post-investment implementation.
Against the backdrop of alternating hot and cold market conditions, the trade-offs of LPs are defining the capital flow and pricing rules of this new cycle. As a market observer deeply rooted in the institutional LP field, FOFWEEKLY has for many years insisted on providing the industry with research and judgment on the development trend and full-scenario map of Chinese institutional LPs.
The 2026 annual LP Barometer survey covers more than 200 active institutional LPs in China, outlining the latest changes in LPs' allocation behavior, decision-making logic and ecological pattern under the current market environment based on first-hand data, aiming to provide industry practitioners with reference coordinates and forward-looking insights.
*The survey period is from March 31, 2025 to March 31, 2026
Core findings of the 2026 LP Barometer include:
I. Market Environment
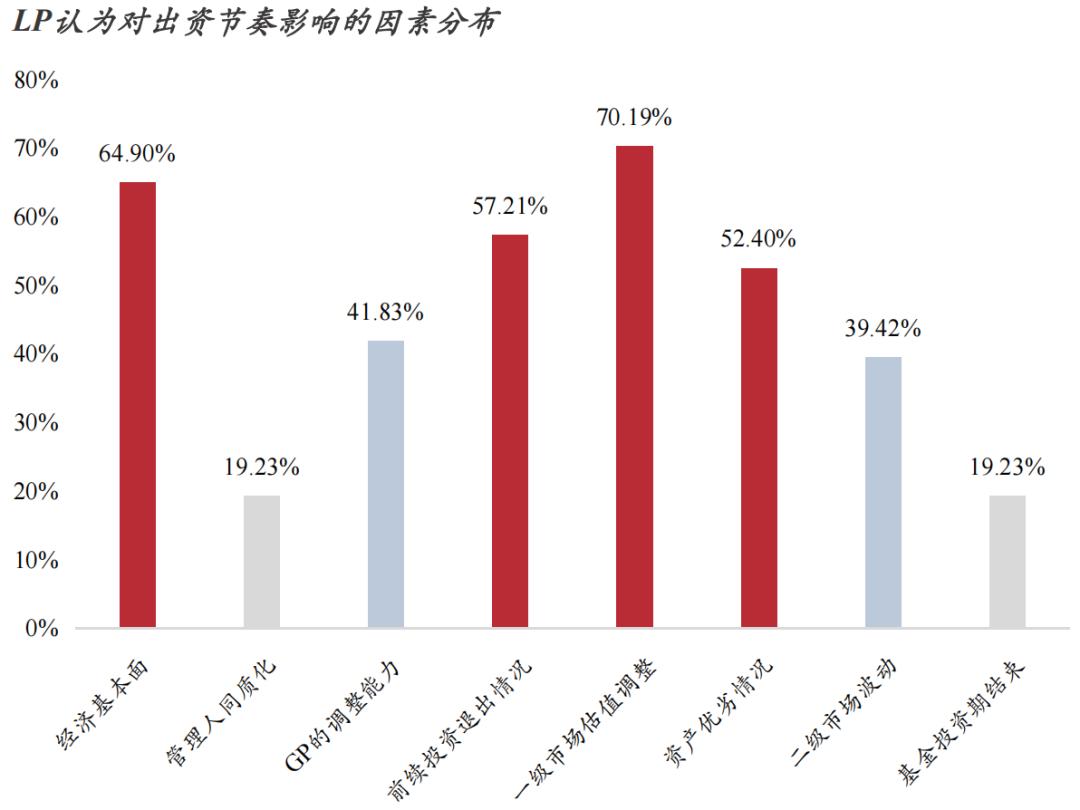
Valuation adjustment and economic expectation are the top two factors affecting LPs' capital contribution.
Over 70% of LPs believe that the valuation adjustment of the primary market has the greatest impact on their capital contribution rhythm, and about 65% of LPs believe that the economic fundamentals have the most significant impact on their capital contribution rhythm; likewise, more than 50% of LPs believe that the exit performance of previous investments and the quality of assets are the core factors affecting their capital contribution.
In addition, GPs' adjustment capability and secondary market fluctuations are also relatively important considerations for LPs.
II. Overview of Capital Contribution: Overall market activity increased significantly from 2025 to 2026
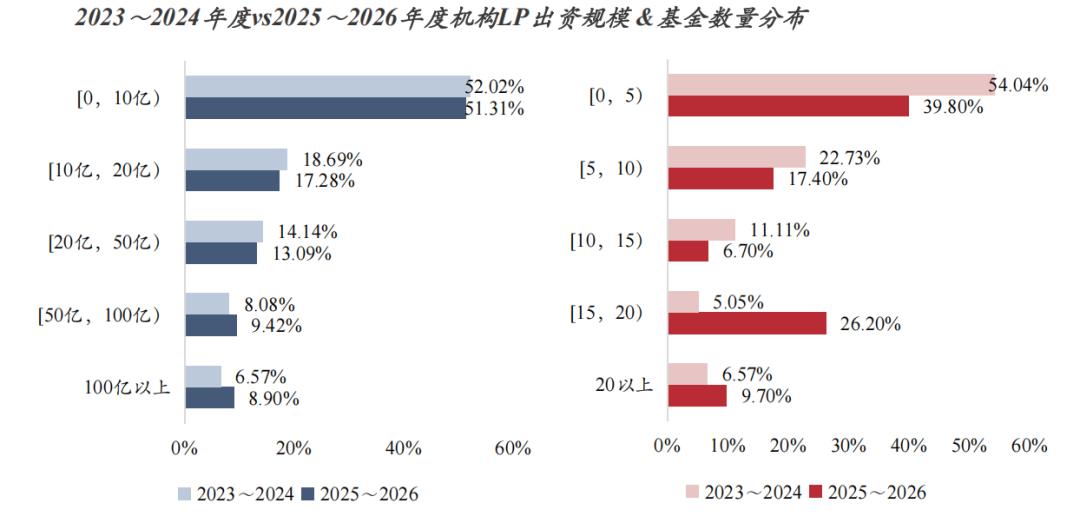
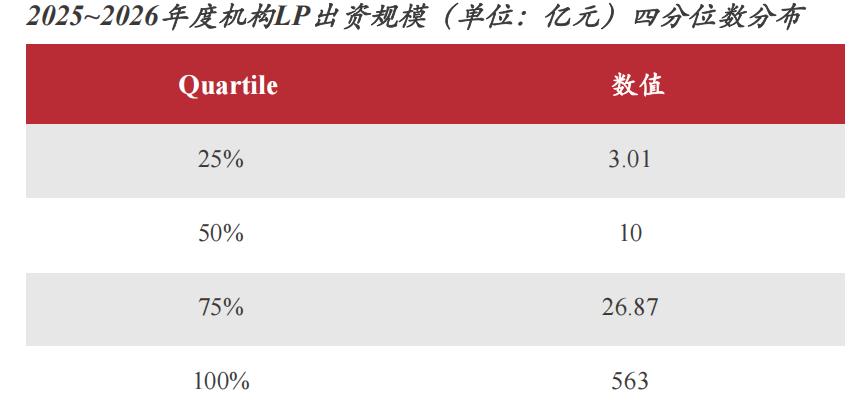
The newly added capital contribution scale of institutional LPs to funds from 2025 to 2026 is mainly distributed in the range of 0-1 billion yuan, and the overall distribution is similar to that of 2023-2024, but the proportion of capital contribution exceeding 5 billion yuan has increased, with a higher extreme value; the number of funds invested has changed significantly compared with 2023-2024, and the proportion of LPs investing in more than 15 funds has increased notably. From the perspective of the quartile distribution of capital contribution scale, 1 billion yuan is the median level of the industry, and the value of the upper quartile and above has also increased significantly.
III. Capital Contribution Progress: LPs' capital contribution decisions have accelerated significantly, with the average paid-in ratio exceeding 40%
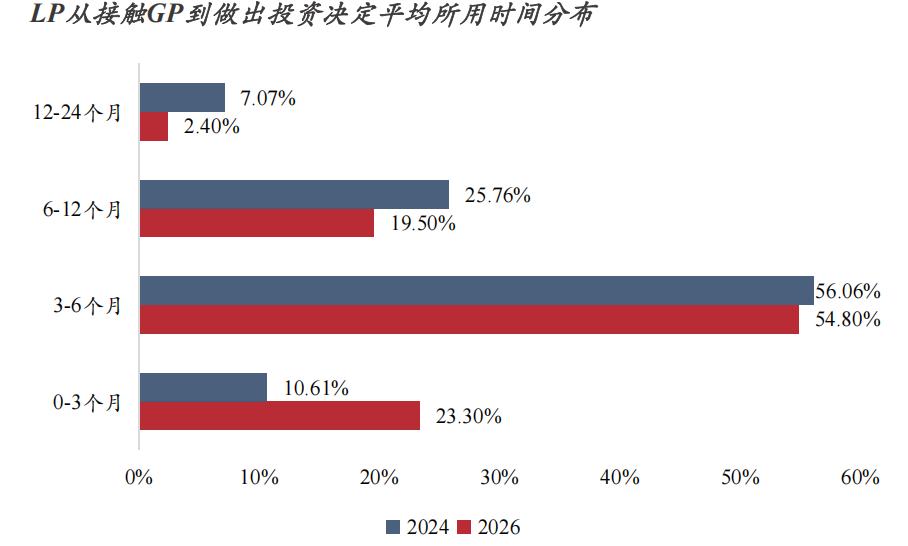
Compared with the overall market situation in 2024, LPs' capital contribution decisions in 2026 have accelerated significantly. The proportion of LPs making investment decisions within 0-3 months after contacting GPs has increased by 119%, and the number of LPs making investment decisions after more than 6 months has decreased notably.
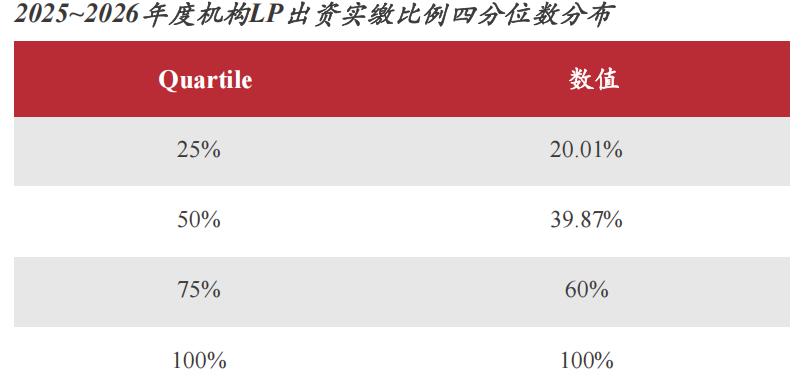
In terms of paid-in performance during this survey period, the average paid-in ratio is 43.3%, the market median level is 39.87%, the lower quartile is 20.01%, and the upper quartile is 60%.
IV. Capital Scale: The newly added investable capital of LPs is commonly 1-5 billion yuan, and their willingness to contribute capital has increased significantly
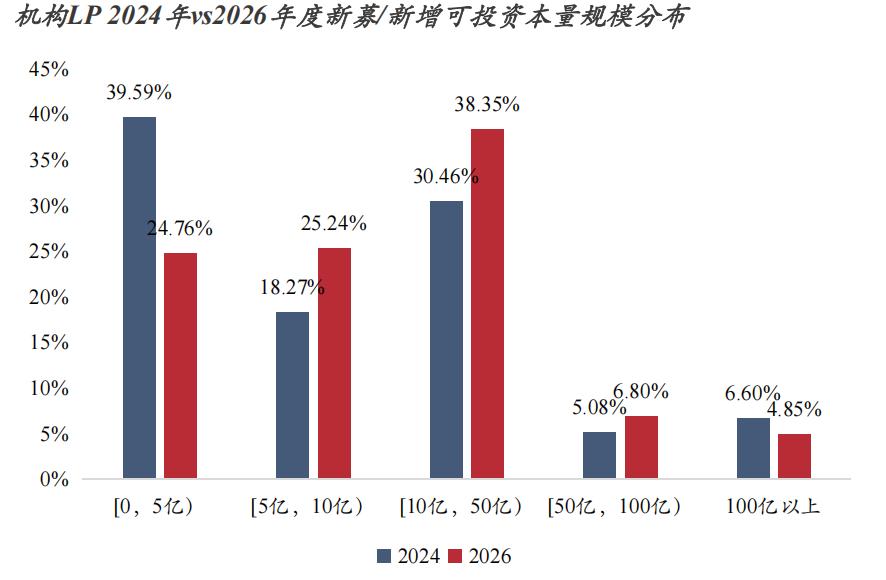
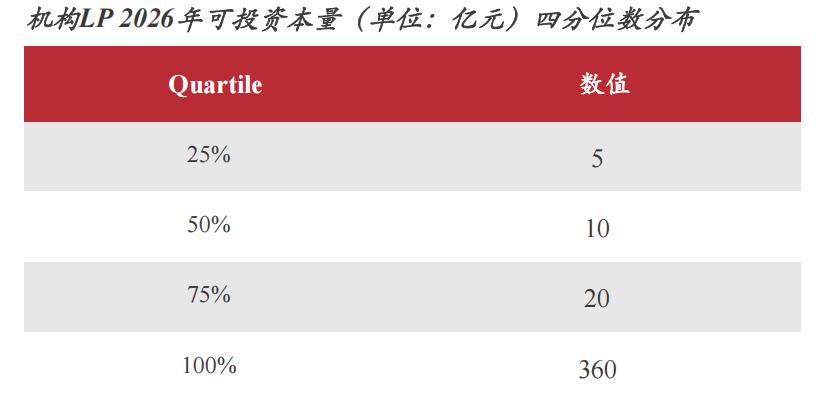
The newly added investable capital of institutional LPs in 2026 is mainly distributed in the range of 1-5 billion yuan. Compared with the data of 2024 and 2025, the distribution of investable capital has shifted significantly to the right; according to the quartile distribution, the upper quartile value of investable capital is 2 billion yuan, the lower quartile value is 0.5 billion yuan, and the median is about 1 billion yuan, which has increased significantly compared with 2024.
V. Capital Sources: In addition to self-owned capital, LPs' capital mainly comes from fiscal funds and State-owned Assets Supervision and Administration Commissions
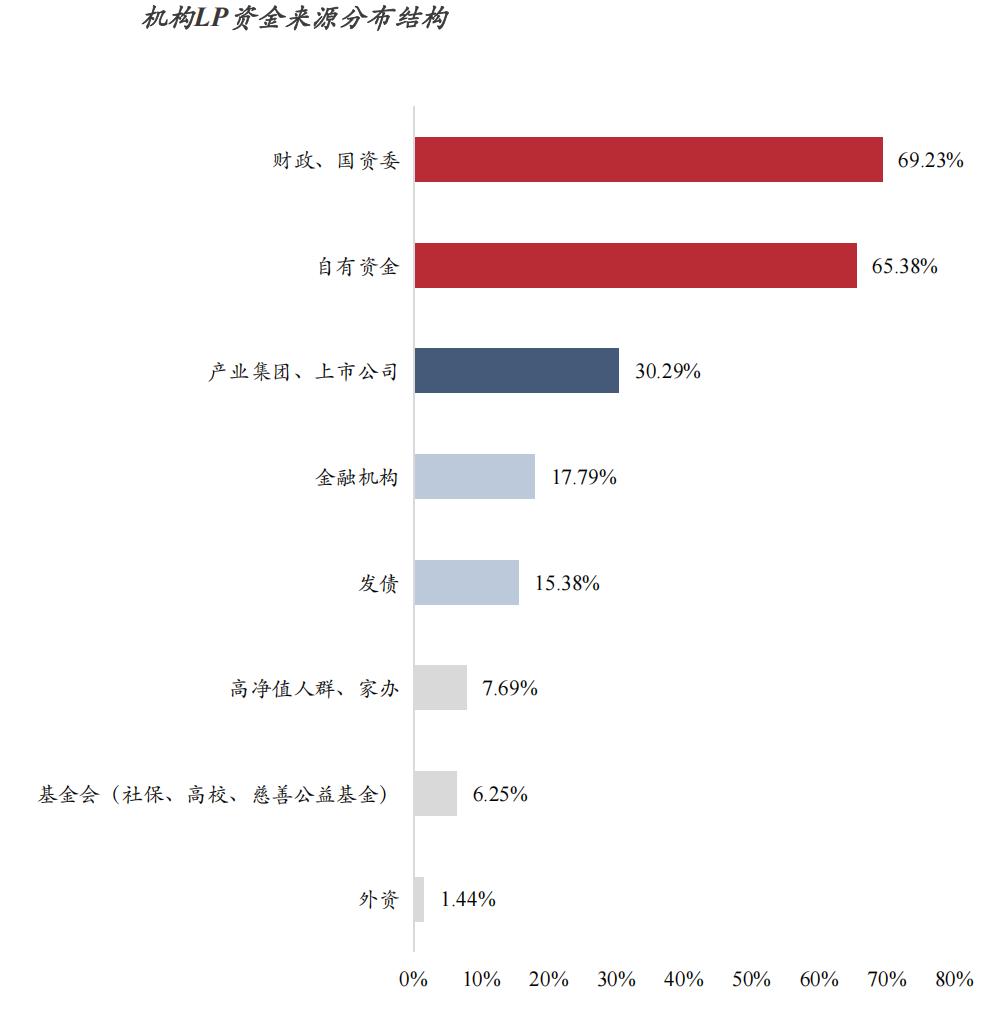
LPs' capital sources are mainly fiscal funds, State-owned Assets Supervision and Administration Commissions and self-owned capital. More than 60% of LPs' capital comes from policy-oriented funds, which is basically consistent with the statistical data two years ago, but the diversity of capital structure has improved. The second echelon is industrial groups and listed companies, with more than 30% of LPs' capital coming from industrial parties.
In addition, in the past two years, some local state-owned capitals and industrial groups have raised funds through sci-tech innovation bonds and private placement bonds, which is also a new source of financial investment capital.
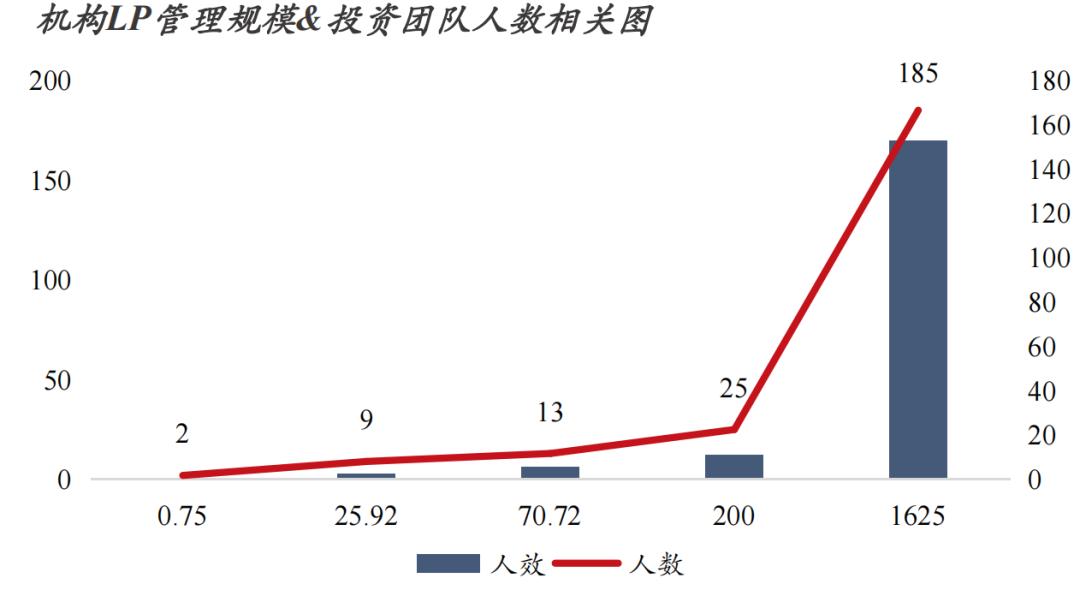
VI. Institutional Allocation: The per capita efficiency of LPs' investment teams shows a significant increasing effect of scale, and leading institutions achieve leading per capita efficiency with systematic management capabilities
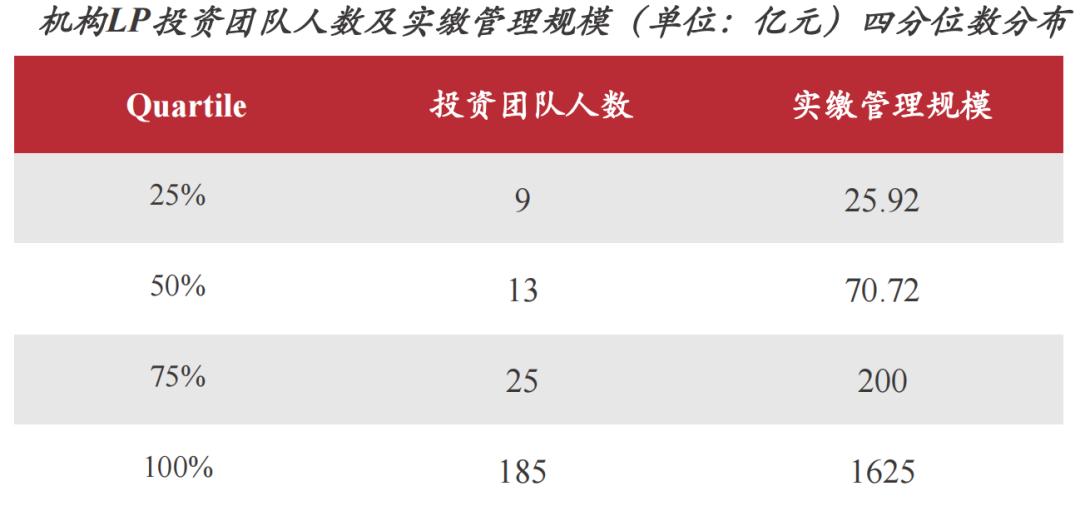
According to statistical data, the paid-in management scale of LPs ranges from 75 million yuan to 162.5 billion yuan, with a median of 7 billion yuan, and the upper quartile value is 20 billion yuan. In terms of team configuration, the number of people in the investment team ranges from 2 to 185, with a median of 13 people, and the upper quartile value is 25 people. On the whole, the industry shows significant differentiation in both management scale and team configuration.
The median per capita investment efficiency (paid-in management scale / number of investment team members) of institutional LPs is 542 million yuan, and the average value is 927 million yuan. The average value is significantly higher than the median, indicating that leading institutions have raised the overall level. In general, the per capita investment efficiency shows a marginal increasing trend, that is, while the management scale expands, the investment and management capabilities of the investment team also improve accordingly, reflecting a certain scale effect.
VII. Performance Return: The comprehensive DPI of most LPs is distributed in the range of 0-0.5, and the comprehensive DPI of leading LPs exceeds 1
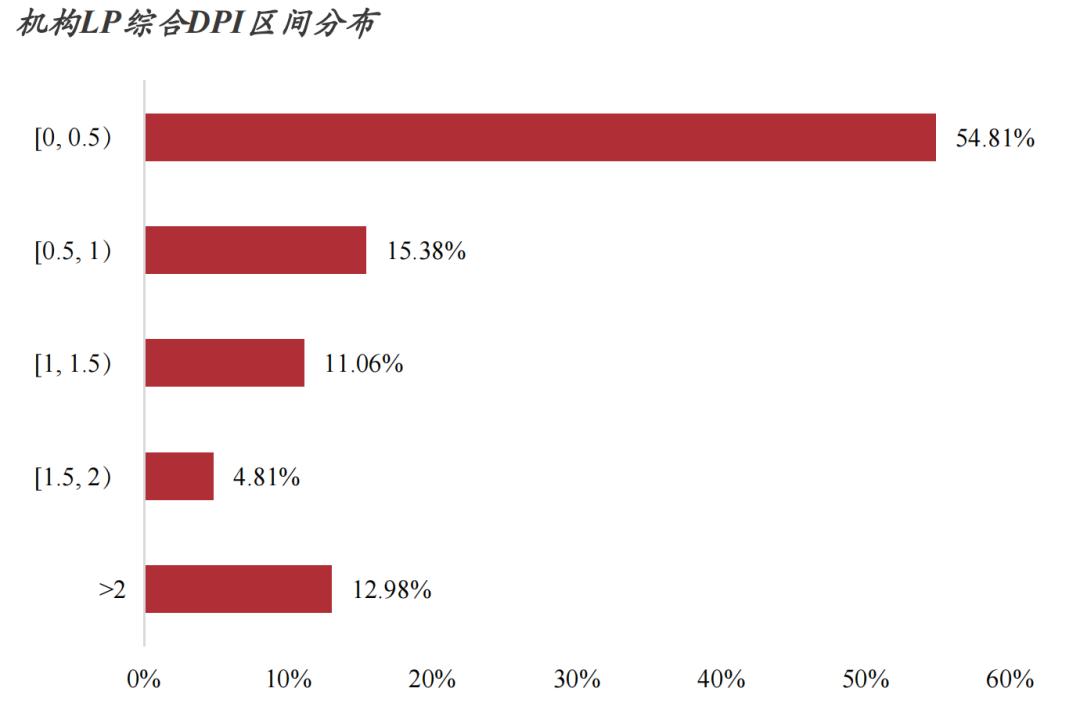
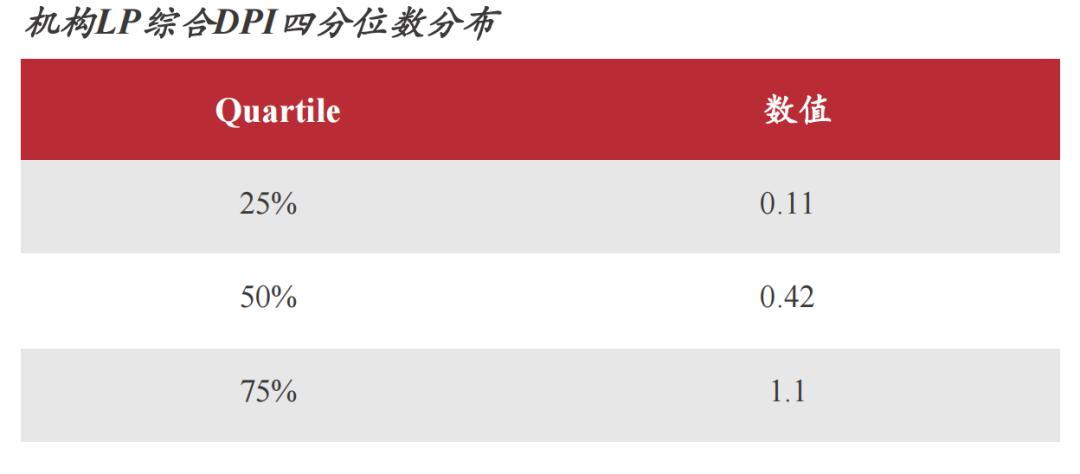
From the perspective of comprehensive DPI distribution, more than half of LPs have a comprehensive DPI lower than 0.5, about 15% of LPs are in the [0.5, 1) interval, and nearly 29% of LPs exceed 1. Compared with direct investment funds or GPs, LPs' comprehensive DPI return speed is slower, and the overall term is longer.
VIII. Allocation Strategy
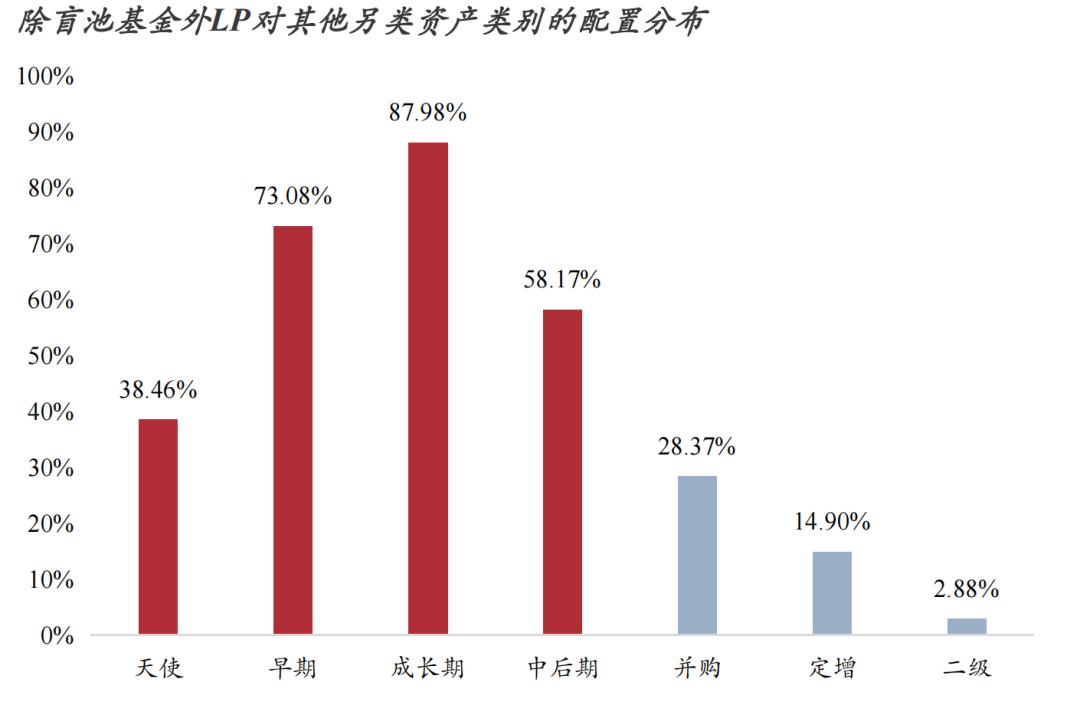
LPs prefer funds/managers at the growth stage and early stage, and their preference for angel and M&A funds has increased
Survey data shows that nearly 90% of LPs in the current market prefer to allocate growth-stage funds, and about 58% of LPs prefer mid-to-late stage project funds; at the same time, the proportion of LPs that prefer early-stage project investment and angel investment institutions has increased, and the proportion of angel investment institutions is close to 40%, reflecting the policy and strategic orientation of "investing earlier and in smaller entities".
Track Focus: Semiconductors, new materials, AI, and embodied intelligence have become the hottest themes
According to the survey, among the key industry tracks deployed by institutional LPs, more than 90% of LPs' invested funds will deploy in the semiconductor & new materials track; more than 85% of LPs will focus on AI and embodied intelligence; the second echelon is new energy and high-end equipment manufacturing (including military industry); the third echelon is healthcare and aerospace.
On the whole, more than 60% of the funds invested by LPs cover the above strategic emerging industries. Under the combined effect of policy guidance and market forces, capital in relevant tracks is highly concentrated.
