The real estate market inventory and unsold floor area have declined for six consecutive months.
A positive signal has emerged in real estate inventory.
Data from the National Bureau of Statistics shows that by the end of August, the nationwide area of commercial housing for sale decreased by 1.1% year on year. This indicator turned negative year on year for the first time in March this year, marking the first occurrence since July 2021, and has declined for six consecutive months by August, with the decline generally expanding.
In response, Puruí Research Center calculated the digestion cycle of the unsold area of pre-approved commercial housing in 30 key cities, and the results show that inventory is indeed declining, but the digestion cycle is rising.
This article is the inventory chapter, which uses data from the first three quarters to clarify the reverse change between inventory and digestion cycle.
01
Data from the National Bureau of Statistics shows that after the nationwide area of commercial housing for sale hit the year's high of 799.98 million square meters at the end of February 2026, it continued to fall, and dropped to 753.49 million square meters at the end of August, a reduction of 46.49 million square meters in half a year.
Meanwhile, the year-on-year growth rate turned negative in March, standing at -0.5% at the end of April, -0.4% at the end of May, expanding to -0.9% at the end of June, and further reaching -1.1% at the end of August.
The National Bureau of Statistics also confirmed at the press conference on the national economic performance in August that the area of commercial housing for sale has declined for six consecutive months since the beginning of this year, and the decline has continued to expand in recent months.
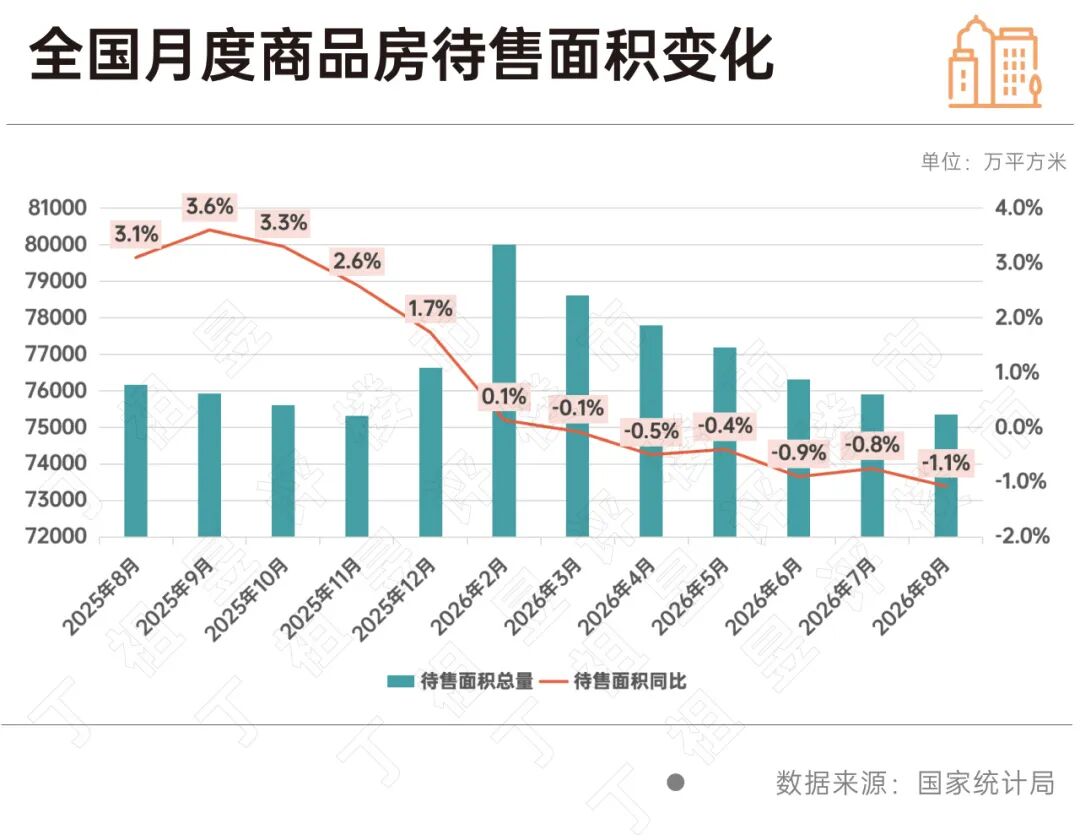
At the end of August, the area of residential housing for sale was 400.83 million square meters, down 0.5% year on year, marking the first decline since September 2021.
02
Monitoring data from PTI Puruí Digital Intelligence Cloud shows that at the end of September, the area of pre-approved unsold new commercial residential housing in 30 key cities was 225.81 million square meters, down 1.4% month on month and 5.5% year on year. The trend of double decline in both month-on-month and year-on-year indicators is consistent with the data of the National Bureau of Statistics.
The pre-approved unsold inventory in first-tier cities stood at 37.8 million square meters at the end of September, a slight increase of 0.4% month on month and a 5.7% decrease year on year, which was the only tier that saw a positive month-on-month inventory growth in the third quarter. After hitting the lowest point since 2026 at the end of July, the inventory rebounded for two consecutive months in August and September. The inventory of second- and third-tier cities at the end of September was 188.01 million square meters, down 1.8% month on month and 5.5% year on year, with its monthly trend also falling first and then rising. Compared with first-tier cities, the second- and third-tier cities have similar year-on-year decline rates, but their absolute scale is 5 times that of first-tier cities. The rebound in inventory in September is directly related to the concentrated release of newly pre-approved housing under the "Golden September and Silver October" node, with the incremental supply exceeding the transaction volume in the month.
Contrary to the downward trend of inventory is the rise of the digestion cycle. At the end of September, the overall digestion cycle of the 30 cities was 21.5 months, 0.46 months longer than the 21.1 months at the end of June, and 3.74 months longer than the 17.8 months at the end of September last year.
The digestion cycle of first-tier cities was 21.2 months at the end of September, 0.27 months longer month on month and 3.30 months longer year on year. The digestion cycle of second- and third-tier cities was 21.6 months at the end of September, 0.50 months longer month on month and 3.82 months longer year on year, hitting the highest value since July 2025.
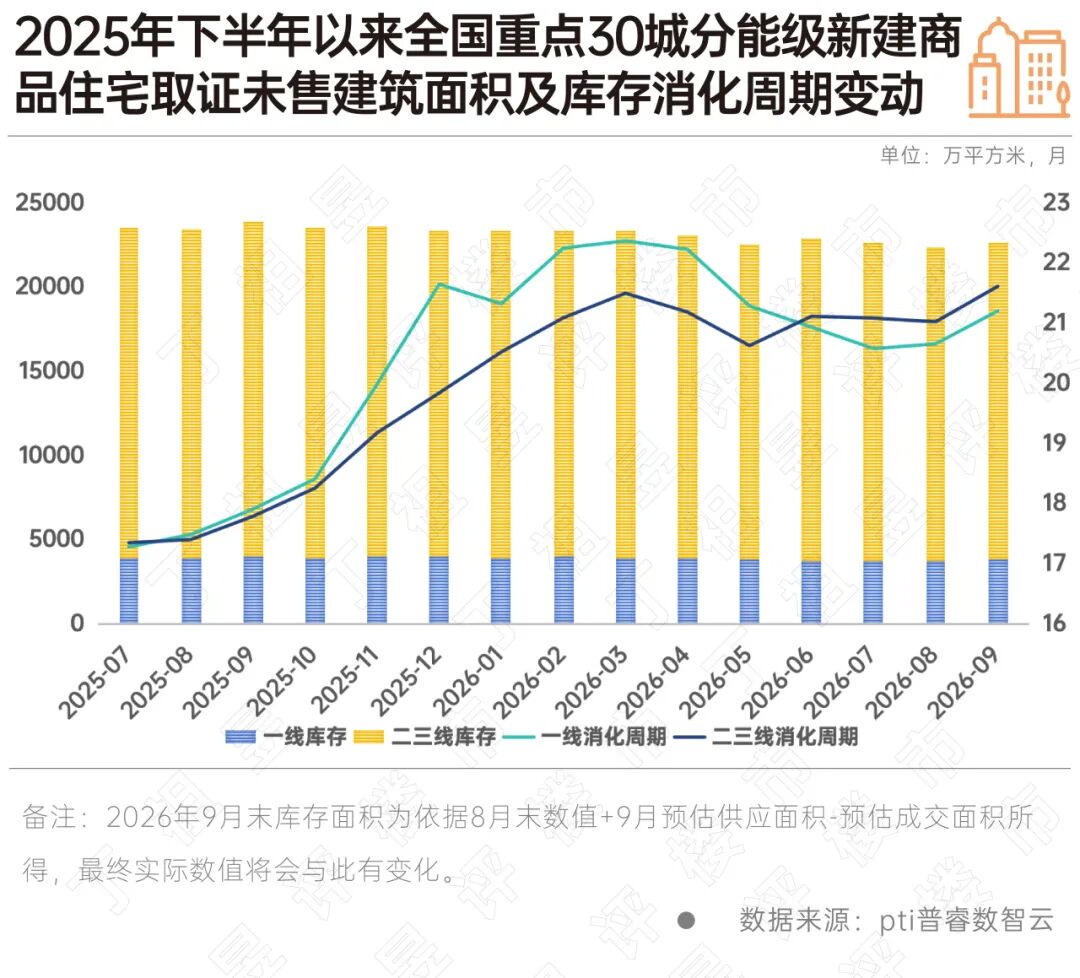
Focusing on cities, the inventory of all four first-tier cities declined year on year, with Beijing down 5%, Shanghai down 5%, Guangzhou down 4% and Shenzhen down 11%; among the 27 second- and third-tier cities, 20 saw year-on-year decline and 7 saw year-on-year rise, Chongqing, Hefei and Ningbo recorded a decline of more than 20%, with the most prominent inventory digestion performance.
The city differentiation of digestion cycle is more significant. At the end of September, only four cities among the 30, namely Chongqing, Hangzhou, Hefei and Shenzhen, had a digestion cycle of less than 15 months. Among the 27 second- and third-tier cities, the digestion cycle of 17 cities lengthened month on month and that of 10 cities shortened; on a year-on-year basis, the digestion cycle of 20 cities lengthened, and only seven cities including Xuzhou, Nanjing, Nanning, Ningbo, Hefei, Chongqing and Kunming saw a year-on-year shortening.
Inventory is declining while the digestion cycle is rising. The only reason for this divergence is that the decline in transaction speed is faster than the inventory consumption rate.
This feature is valid for both first-tier and second- and third-tier cities: the inventory of first-tier cities decreased by 5.7% year on year with the digestion cycle lengthening by 3.3 months, while the inventory of second- and third-tier cities decreased by 5.5% year on year with the digestion cycle lengthening by 3.8 months.
The inventory improvement in the third quarter mainly came from the contraction of the supply side rather than the repair of the demand side. This also explains why while the total inventory continues to decline, the digestion pressure perceived by the market has not been reduced synchronously.
We believe that inventory will continue to be slightly destocked in the fourth quarter. The supply and transaction volume in the fourth quarter will rise in the same direction month on month. It is expected that the month-on-month inventory change will be between -2% and 0%, and the year-on-year decline will narrow to 4%-5%; affected by the rise of the base in the fourth quarter of last year, the year-on-year lengthening range of the digestion cycle will narrow from 3.74 months to about 2.5 months, and the digestion cycle will remain at a high level of 21-22 months month on month.
This article is from WeChat official account "Ding Zuyu's Real Estate Review", Author: Puruí Research, Editorial Department, published with authorization from 36Kr.