Four signals are lit up simultaneously, and China's automotive industry is on the eve of a new round of market clearance.
The automotive industry scene in September is extremely lively: Xiaomi launched a new extended-range electric vehicle, multiple car enterprises successively announced targeted cooperation with second-tier battery manufacturers, Geely adjusted its top management, and SERES and Huawei modified their cooperation model. There have been plenty of commercial interpretations on this, but setting aside all the noise, a major asset restructuring announcement jointly released by GAC and FAIC may have a far more profound long-term impact on the whole industry.
The automotive industry has long been known as the crown of the manufacturing sector, and is referred to as the "industry of all industries" in Womack's works. The value of the automotive industry to the manufacturing sector is self-evident. However, no flower can stay in full bloom for a hundred days. The century-old history of the automotive industry tells us that there are always glorious pasts, and the industry will inevitably go through peaks and troughs.
This is exactly the case from Detroit in 1920 and 1982, to Nagoya in 1991, and then to Stuttgart in 2008.
Since the discourse power of the automotive industry chain shifted to China, the term "supply-side clearing" has been brought up for discussion almost every year. The story of "the wolf is coming" has been heard for several years, but standing at the current point in 2026, we believe that there are four relatively obvious signals proving that China's automotive industry is about to enter a new round of clearing period.
01
Signal 1: The current capacity utilization is clearly far below the break-even line
Setting aside all distractions and starting from the origin of economics, the only rigid indicator that determines the rise and fall of an industry is actually the relationship between supply and demand. Since the transformation to new energy vehicles, China's automotive consumer market, especially the new energy vehicle segment, has shown prosperity on both supply and demand sides, with overall demand slightly exceeding supply.
At present, however, the overall supply-demand relationship of China's automotive industry is undergoing some irreversible and subtle changes:
(1) The penetration rate of new energy vehicles has exceeded 65% at this stage, and the growth rate will inevitably slow down for a long time
As is known to all, the overall growth rate of new energy vehicles in the first half of the year quickly dropped to 7.3%. From the market perspective, there are indeed many objective reasons, such as the subsidy withdrawal at the end of last year, the adjustment of trade-in policies in some regions, and so on.
But a fact that cannot be ignored is that the room for growth on the demand side at this stage is inherently limited.
In the theory of innovation diffusion, there is a classic S-Curve that describes the relationship between penetration rate and growth rate: the diffusion of new products usually follows an S-shaped curve, with slow growth in the initial stage, entering an accelerated outbreak period after breaking through the critical point, and when the penetration rate exceeds 50%, the slope of the curve begins to flatten and the growth rate declines.
As of August 2026, according to Wind's statistical caliber, new energy vehicles have stood at a high level of over 65% for two consecutive months, which undoubtedly indicates that the new energy vehicle sector is currently in the "mature growth period".
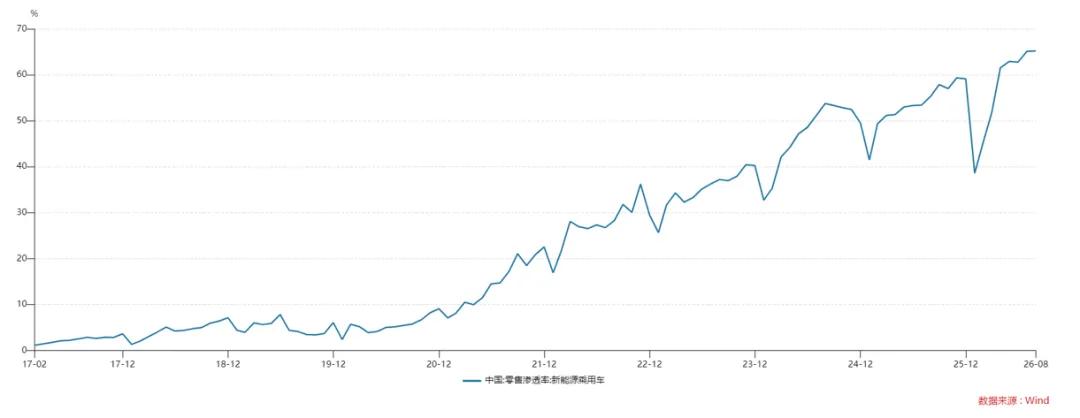
For this reason, if we only look at the domestic market, even without the influence of external objective factors, the incremental growth driven by the demand side is very limited.
(2) Calculated based on the expected production capacity caliber, the capacity utilization rate may be significantly pulled down
Then look at the supply side, the most intuitive data is the capacity utilization rate (assuming the value of finished products produced per unit of labor time is the same, we can equate capacity utilization rate with operating rate). The capacity clearing of the US automotive industry in 1982 and the capacity clearing of the Japanese automotive industry in 1991 both took the operating rate falling below a certain threshold as the guiding indicator.
Although the US automotive industry has been in a relatively depressed state after the two oil crises, the real forward-looking indicator is still the equipment operating rate. In 1982, this indicator fell to around 50%, and General Motors recorded its first annual loss since 1920.
According to the retrospective study of the research report "Transformation of Japan's Automotive Industry" from Hosei University, the prelude to the clearing of the Japanese automotive industry was also the operating rate. After the domestic production reached the peak of 13.49 million units in 1990, it dropped to 9.9 million units in the following ten years, a decrease of nearly one third. However, the progress of capacity reduction was extremely slow, and the operating rate quickly fell below 80%. By 1999, the total excess capacity of 11 Japanese automakers was still equivalent to more than 28% of the output of that year, and the clearing process accelerated simultaneously.
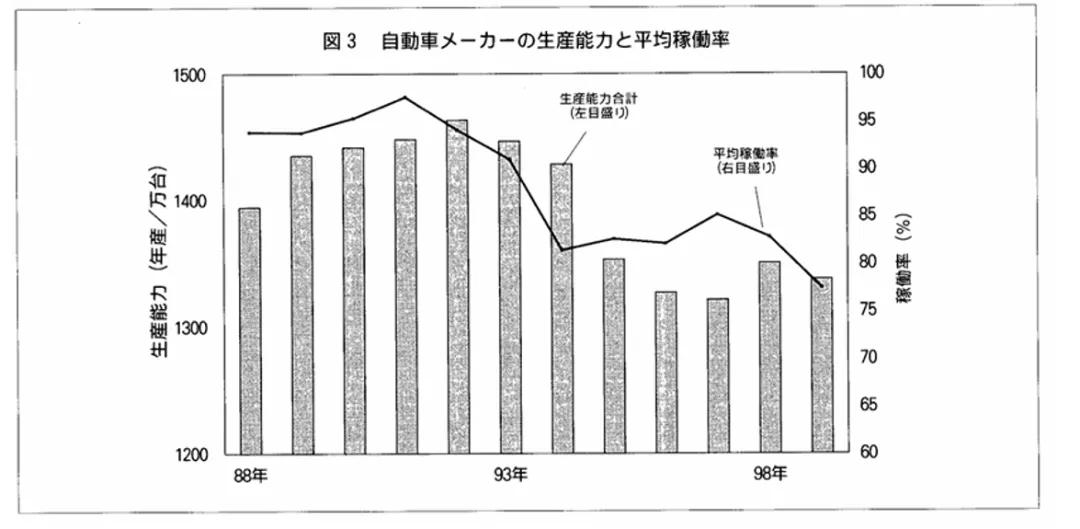
Figure: Japan's automotive capacity data from 1988 to 1998, Source: "Transformation of Japan's Automotive Industry"
The situation in Europe is generally the same. According to the report of "Auto Motor und Sport", the average capacity utilization rate of German factories in 2008 was 64%, and according to the report of "Just Auto", the overall capacity utilization rate in Europe further dropped to about 60% in 2009.
In fact, as early as before the full outbreak of the crisis in the autumn of 2008, European automakers already believed that the total excess capacity of European automobiles was about 20%. This means that overcapacity was already a structural problem before the financial crisis, which only accelerated the clearing process.
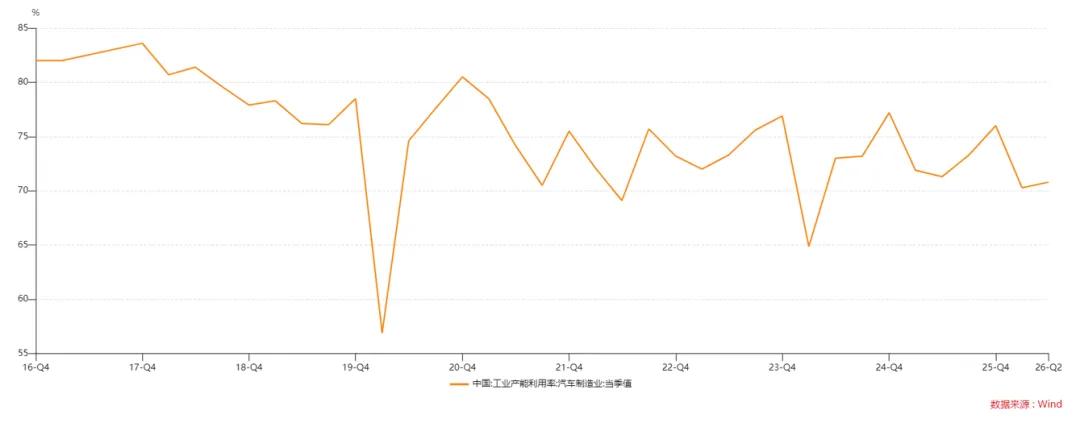
According to the latest data released by the National Bureau of Statistics of China, the overall capacity utilization rate of China's automotive manufacturing industry as of June this year is 70.8%, which has dropped by 13 percentage points compared with the relatively high level of 83% in 2017.
More critically, the entire automotive industry chain has been strongly stimulated by the demand side in the past five years, and the growth of under-construction capacity has not slowed down. From the perspective of financial reports:
· For A-share auto parts and equipment enterprises, the balance of construction in progress in the mid-term report of this year is 67.6 billion yuan, an increase of 19.2% compared with the end of last year.
· For A-share auto manufacturing enterprises, the balance of construction in progress in the mid-term report of this year is 84.1 billion yuan, an increase of 28.1% compared with the end of last year.
· For Hong Kong-listed auto manufacturing enterprises (mainly new energy vehicles), the balance of construction in progress in the mid-term report of this year is 74.6 billion yuan, an increase of 38% compared with the end of last year.
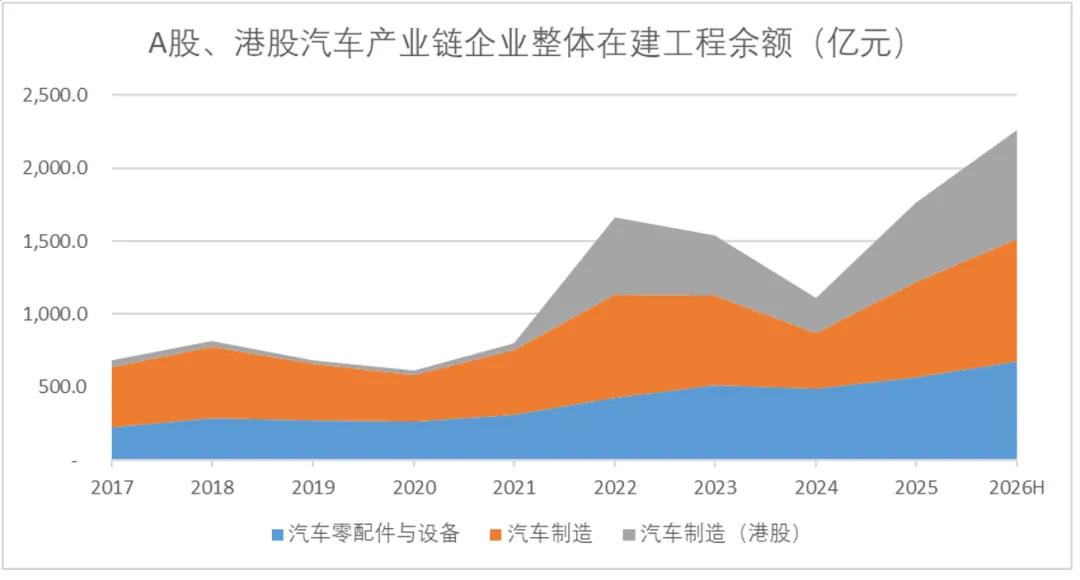
Although automakers have not clarified how much of the construction in progress is related to actual production capacity, looking only at new power brands including NIO, XPeng, Li Auto, Leapmotor, Xiaomi and SERES, Xiaomi, XPeng and Leapmotor all have new production lines to be put into operation soon.
If all these foreseeable expected capacities are taken into account, coupled with the slowdown in the growth rate of the demand side, it is predictable that the future capacity utilization rate may be even lower.
(3) We should not only focus on the capacity utilization rate of new energy vehicles, there is a correlation between the overall capacity of automakers
Of course, the main view of the market on capacity clearing at this stage is that the capacity of fuel vehicles may be in surplus, but the capacity utilization rate of new energy vehicles is still very high, so it is too early to talk about clearing. According to the estimate of Zhang Hong, a member of the Expert Committee of the China Automobile Dealers Association, the capacity utilization rate of new energy vehicles is about 83%.
However, in the vehicle manufacturing process, the capacity of many links is "flexibly shared" by fuel vehicles and new energy vehicles. For example, SAIC previously mentioned in the investor interaction that among its 6.99 million designed capacity, except for the 240,000 pure electric exclusive capacity of SAIC Volkswagen MEB factory, the remaining 6.75 million capacity is "shared by fuel vehicles and new energy vehicles".
FAW, Geely and other automakers also have related co-production capacity. According to previous reports from China Energy Network, there is currently at least 30 million units of fuel vehicle capacity, and 2 million to 3 million units of fuel vehicle capacity (mainly extended-range electric) have been digested through fuel-to-electricity conversion. Even if the proportion is not high, when averaged to the denominator of the total 20 million new energy capacity, it can also affect the capacity utilization rate by about 7%-10%.
In the newly released smart connected new energy vehicle industry plan, capacity early warning and regulation has been written into the five-year plan for the first time, listed as one of the 17 key tasks. Because even the 83% capacity utilization rate is far from completely risk-free.
From the horizontal comparison of capacity utilization rates in the manufacturing industry, the automotive industry generally regards 80% as the traditional break-even point, and 75% as the warning line for the overall health of the industry. From the overall perspective of China's automotive industry, it has fallen below the health line, and new energy vehicles are now close to the break-even point.
02
Signal 2: Exit mode has changed from "poor operation" to "asset disposal"
If the capacity utilization rate is the digital prelude to the era of large-scale clearing, the change of models around asset disposal is a more micro and specific signal: the way players exit this industry has reversed.
Historically, there were 253 active automakers in the United States in 1908, which dropped to 108 by 1920, and only 44 remained in 1929. In the early stage of collective clearing, the main market tone for bankrupt and liquidated manufacturers was negative, believing that Henry Ford's company produced 60% of all automobiles in the United States, while small and medium-sized manufacturers were relatively weak and suffered from poor operation.
In the collective clearing period, "long-established and respected names are disappearing from the directory, and it seems inevitable that more companies will exit". The most decent way is to take the initiative to liquidate when part of the assets can still be recovered.
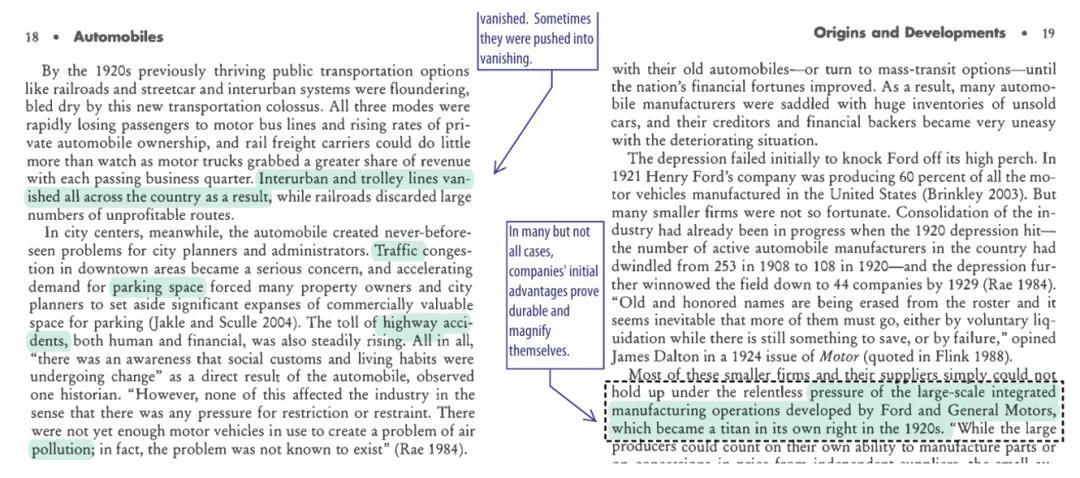
Figure: Reports related to the clearing pace of US automakers, Source: "The Industrial Revolution in America: Automobiles, Vol. 4"
In this stage, the most typical feature is that the number of mergers and acquisitions declines (the activity of financial capital decreases), but the quality of mergers and acquisitions and the amount of single transaction rise (pure asset disposal). The reason is easy to understand: speculators with relatively few assets are the first to be eliminated due to "poor operation", while enterprises with real asset value tend to sell their assets at a reasonable consideration in the early stage of large-scale clearing, thus showing a trend of decreasing number and rising single transaction amount.
Looking back at domestic automakers, the change of exit path is roughly the same. Before 2025, most auto companies, including Byton that never achieved mass production, WM Motor that once hit the top of new power sales list at its peak, Hozon and Ji Yue known for their "design sense", all persisted until the last night of cash flow breakdown.
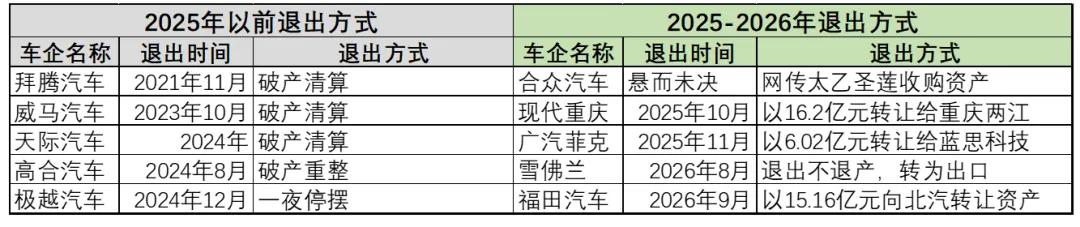
After 2025, most automakers, especially those that enjoyed a high reputation in the fuel vehicle era, sold their assets for cash. Moreover, according to the research report of PwC, the biggest trend of M&A in China's automotive industry in 2025 is the decline in quantity and the rise in single transaction amount.

Figure: Unit price and change range of automotive industry M&A in 2025, Source: PwC, sorted by Financial Report Record
Compared with waiting for a higher price, industry chain enterprises with relatively backward product power and brand power at this stage are more willing to sell their assets at an appropriate price. In a sense, this is the active formation of industry consensus - the previously determined players begin to admit defeat voluntarily.
03
Signal 3: The price system has switched from "maintaining profits" to "maintaining cash flow"
Three years ago, Li Xiang, who was very active on social media at that time, posted a long Weibo post about the overall loss-making car sales in the automotive industry: "An auto enterprise with basic common sense will generally set the stable gross profit margin of products between 15% and 25% when the product is approved for development, and the worst case will not be lower than 15%."
From the perspective at that time, few vehicle manufacturers seemed to mention the profit margin issue anymore. The core reason is that under the dual squeeze of supply-side cost and demand-side competition, almost no automaker can maintain profits.
