Sand Table Simulation: Can Tencent's revenue growth in the next two years support the 500 billion-yuan computing power expansion?
In the investment circle, "never simply extrapolate the future based on historical growth rates" is almost a universal consensus. High growth in the past decade does not mean high growth in the next decade. Any variable, be it a shift in industry cycle, subversion of competition landscape, adjustment of regulatory policies, or iteration of technical routes, could make the originally smooth growth curve turn sharply downward.
However, this common sense should also be viewed in light of different development stages and the inherent quality of individual companies. When an enterprise completes the incremental expansion era of rapid market grabbing, its core business enters a steady operation period, the growth center gradually converges, and the fluctuation range keeps narrowing, the reference value of its historical track will rise significantly instead.
Tencent Holdings has just reached such a stage. After more than 20 years of development and iteration, Tencent's core business layout has been highly clear and stable. Its three core segments have successively passed the inflection point of explosive growth, with the growth logic shifting from "expansion-driven" to "efficiency-driven", and the trend stability far exceeding the industry average level.
The gaming business has bid farewell to the domestic demographic dividend and entered a new stage of high-quality operation and global expansion; marketing services are firmly rooted in the basic foundation of the WeChat ecosystem, with Video Accounts opening up a second growth curve; FinTech and enterprise services are deeply aligned with the digitalization rhythm of the real economy, transitioning from rapid market grabbing to steady in-depth operation.
It is precisely for this reason that we choose "linear extrapolation" as the benchmark perspective for the entire analysis. It should be specially noted that the linear extrapolation here is by no means a mechanical deduction of applying formulas and calculating figures, but a steady-state growth center based on empirical judgment, which is derived from segmental business data from 2018 to 2026 combined with industrial rules and operation rhythms, to build a baseline scenario free from the impact of major variables.
The significance of this baseline is not to accurately predict the performance figures of a specific year, but to provide a value scale for readers' reference. For growth rate judgments that you do not agree with, you can revise them independently to form your own conclusions. Of course, we never believe that history will repeat itself in a simple way, and AI strategic investment is currently the biggest "non-linear variable" for Tencent. Next, we will first break down the growth rhythm and profit changes of the three major businesses, build a benchmark growth framework, then superimpose the long-term impact of substantially increased investment in computing power infrastructure, and finally arrive at the investment value judgment.
01
Value-added Services: Steady Recovery of the Growth Center
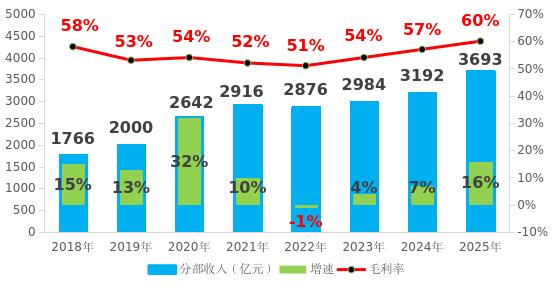
Evolution Chart of Tencent Holdings' Value-added Services Revenue, Growth Rate and Gross Margin from 2018 to 2025:
Data Source: Company Annual Report
Value-added services are Tencent's most traditional basic foundation, as well as the segment with the largest historical growth fluctuation. Since 2018, its growth track has developed around three main lines: "product cycle, regulatory policy, and overseas expansion", showing obvious pulse characteristics.
The suspension of game license issuance in 2018 directly dragged the segment's growth rate from 43% in the previous year to 15%. The stay-at-home economic dividend during the 2020 epidemic pushed the growth rate back to 32%. The new minor anti-addiction regulations combined with the second suspension of game license issuance in 2021-2022 caused the growth rate to slide all the way to negative growth. It did not gradually recover until 2023, and returned to double-digit growth of 16% in 2025 driven by multiple new hit products.
By breakdown, domestic gaming is the core basic foundation of value-added services, and also the main source of fluctuation. In 2025, domestic gaming revenue reached 164.2 billion yuan, accounting for 45% of the entire value-added services segment, making it the largest single sub-sector of business.
In the past eight years, domestic gaming has experienced two complete cycles: the first was the mobile dividend driven by Honor of Kings from 2016 to 2017, and the second was the epidemic dividend catalyzed by Peacekeeper Elite in 2020, with the 2018 game license winter sandwiched between the two.
After the regulatory adjustments in 2021-2022, the growth logic of domestic gaming has undergone essential changes — shifting from user quantity expansion to high-quality operation and ARPU improvement. With the normalization of game license approval and the gradual release of new product pipelines, Delta Action became a phenomenal hit in 2024, verifying the explosive power of high-quality content in the stock market. Judging from the current product pipeline and industry rhythm, domestic gaming has come out of the trough of regulatory adjustment and entered a new round of product release cycle.
Overseas gaming is the most certain source of incremental growth in the past five years. In 2025, overseas gaming revenue reached 77.4 billion yuan, accounting for 32% of total gaming revenue and 21% of the overall value-added services. From less than 20% of total gaming revenue in 2018 to 32% in 2025, the overseas market has changed from a "supplement" to a "second growth curve".
The long-term operation of Supercell and the global performance of PUBG Mobile jointly promote overseas gaming revenue to maintain double-digit growth for many consecutive years. Compared with the user ceiling of the domestic market, the global gaming market has a broader space, and Tencent's R&D and operation advantages are still continuously releasing. Under the baseline scenario where no extreme changes occur in geopolitics, the overseas market still has stable penetration space.
Social network value-added services have long entered a stock steady state. Revenue in 2025 was about 127.7 billion yuan, accounting for 35% of the value-added services segment. Its internal composition is dominated by digital content value-added services, with core carriers being two major content platforms Tencent Video and Tencent Music, as well as services including live streaming and virtual props.
At present, the long-video industry has fully entered the stage of stock competition, with user growth peaking, membership penetration approaching the ceiling, and content procurement and production costs remaining high, leading to continuous pressure on Tencent Video's revenue growth; Tencent Music is facing strong competition from Douyin's Qishui Music, with price wars and copyright competition intensifying in the online music industry, and traditional membership revenue growth has basically stagnated. The growth rate of this segment was still 30% in 2018, but fell back to 5% by 2025, showing typical characteristics of mature businesses.
Based on past development, the author judges that: domestic gaming will maintain a growth rate of around 15% relying on new product pipelines and ARPU improvement; overseas gaming will maintain a steady growth rate of around 10% supported by its global layout; social networks will enter a mature steady state, with a growth rate basically matching the macro economy, taking a low single-digit growth of around 3%. Overall, the overall benchmark growth center of the value-added services segment is about 8%-10%.
02
Marketing Services: High Certainty of Double-digit Growth
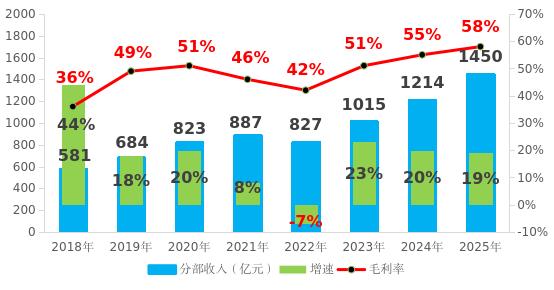
In the past eight years, the advertising business has gone through three stages: 2018-2020 was the traffic dividend period of Moments ads, where the rapid growth of social advertising offset the decline of media advertising; 2021-2022 was the adjustment period with multiple headwinds superimposed, where the "double reduction" policy for the education sector, macroeconomic downturn, and short-video competition jointly put pressure, dragging the segment's growth rate from 20% to negative growth; since 2023, it has been a new growth cycle driven by Video Accounts, superimposed with AI technology empowerment, making advertising revenue return to the track of double-digit high-speed growth.
Evolution Chart of Tencent Holdings' Marketing Services Revenue, Growth Rate and Gross Margin from 2018 to 2025:
Data Source: Company Annual Report
The core to understanding Tencent's advertising is to see clearly the scissors gap trend of "sustained growth of social advertising and structural contraction of media advertising". In the early stage, Tencent's advertising consisted of social advertising (Moments, QQ Zone) and media advertising (Tencent Video, Tencent News). But as user attention fully shifts to the WeChat ecosystem, the user base of media advertising continues to shrink, with negative growth for many consecutive years starting from 2019. In contrast, advertising scenarios within the WeChat ecosystem keep expanding, from Moments to Mini Programs, then to Video Accounts and Search, forming a multi-layered ad inventory matrix. This structural differentiation is a long-term trend that will not reverse.
At the current stage, Video Accounts are the core engine of advertising growth, and AI is the key variable to amplify growth efficiency. User duration on Video Accounts is still continuously increasing, while the ad load rate is far lower than mainstream short-video platforms in the industry, which means there is considerable growth space just by increasing inventory. More importantly, AI technology is reconstructing advertising efficiency from the bottom up: on the one hand, it improves click-through rate and conversion rate through precise targeting models, pushing up ad unit prices; on the other hand, it reduces production costs for advertisers through AI-generated creative materials, increasing their willingness to place ads.
Judging from historical growth rates, the growth rates of the marketing services segment in 2023-2025 were 23%, 20%, and 19% respectively, remaining stable at around 20% for three consecutive years, which has verified the growth momentum of Video Accounts commercialization and AI empowerment. Compared with the high growth rate in the early Moments advertising dividend period, this round of growth has higher quality. It not only includes the increase of ad inventory, but also the improvement of unit price and efficiency, making the growth more sustainable.
Based on past development, the author judges that the marketing services segment can maintain a 20% growth rate in recent years. As the business with the largest growth elasticity among the three major segments, marketing services will be an important driving force for Tencent's overall revenue growth in the next two to three years.
03
FinTech and Enterprise Services: Combination of Stabilizer and High Elasticity
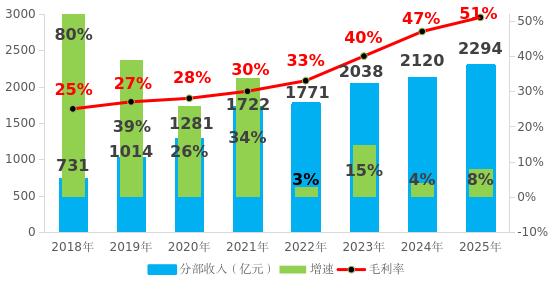
Evolution Chart of Tencent Holdings' FinTech and Enterprise Services Revenue, Growth Rate and Gross Margin from 2018 to 2025:
Data Source: Company Annual Report
FinTech and enterprise services are the business with the highest growth certainty and the most thorough transformation among Tencent's three major segments. From a marginal role classified as "other businesses" before 2018, to being independently disclosed as one of the three core segments in 2019, and then to actively shifting from scale priority to profit priority in 2022, this segment has completed the transformation from rapid market grabbing to in-depth operation in eight years. Compared with the product cycle fluctuation of value-added services and the macro cycle fluctuation of marketing services, the growth track of FinTech and enterprise services is smoother and more resilient, acting as the "stabilizer" of Tencent's revenue.
Among them, the FinTech business is the stabilizer of the segment, mainly including commercial payment, wealth management services, consumer credit, etc. After years of rapid penetration, the mobile payment market has entered a duopoly steady state. There is limited space for growth in the user scale and transaction volume of WeChat Pay, and the growth momentum has shifted from user penetration to transaction amount improvement and service scenario expansion. Products including Licaitong and Weilidai have gradually matured, contributing stable incremental revenue. Overall, the FinTech business has entered a mature period, with its growth rhythm highly correlated with offline commercial activity and residents' consumption capacity, and the growth rate gradually converging to a high single-digit level.
Enterprise services are the source of elasticity within the segment, with the core being Tencent Cloud and merchant technical services. In the past, this segment was in the stage of "burning money for scale" for a long time, actively taking low-profit projects to seize market share, with large growth fluctuation and weak profitability. After the strategic adjustment in 2022, Tencent Cloud abandoned low-quality projects and focused on advantageous industries, with continuous improvement in profitability, and achieved large-scale profitability in 2025. At the same time, the rapid development of WeChat Shop and Video Accounts e-commerce has also driven the growth of merchant technical service fees.
Judging from historical performance, the growth rate of the FinTech business has gradually fallen from high growth to a steady state of around 6%, which conforms to the general rule of the mature payment industry; enterprise services have re-accelerated after the strategic adjustment, with the growth rate rebounding to nearly 20% driven by AI. The combination of one stable and one fast growth creates the "steady but not dull" growth feature of the entire segment. The segment's growth rate dropped as low as 3% in 2022, which was the result of active strategic adjustment rather than deterioration of fundamentals; with the effect of the profit-priority strategy and the release of AI dividends, the segment's growth rate returned to the reasonable range of 8%.
Based on the empirical judgment of linear extrapolation, the author sets different growth rate benchmarks for the two parts of the segment: the FinTech business maintains a steady growth of around 5%, matching the growth rate of the macro economy and commercial activities; enterprise services benefit from the outbreak of AI demand and maintain a relatively fast growth of around 20%.
In its 2025 annual report, Tencent Holdings disclosed that revenue from FinTech and enterprise services increased by 8% to 229.4 billion yuan, with FinTech growing at a high single-digit percentage and enterprise services growing close to 20%. According to the author's estimation at a 6% growth rate for FinTech, the scale of FinTech is in the range of 190 billion yuan, and the revenue of enterprise services is around 40 billion yuan. Overall, the overall benchmark growth center of the FinTech and enterprise services segment is about 8%, with both certainty and growth potential, serving as the core support for Tencent's steady-state growth.
04
Can Revenue Growth Support 500 Billion Yuan of Computing Power Expansion?
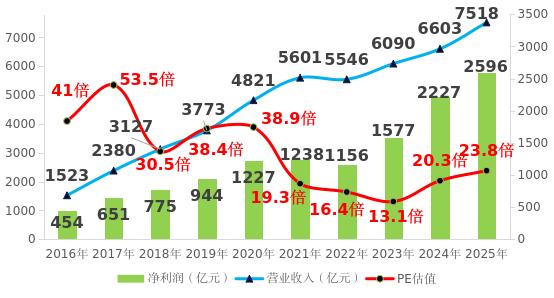
Following the breakdown of the three major business segments in the previous three parts, from the perspective of revenue structure, the proportions of value-added services, marketing services, and FinTech and enterprise services in total revenue in 2025 were 49%, 19%, and 31% respectively. Combined with the extrapolated growth rate of each segment, weighted calculation shows that the overall steady-state growth center of the company's total revenue is about 10%.
Evolution Chart of Tencent Holdings' Revenue, Profit and Valuation Trend from 2016 to 2025:
Data Source: Wind, Company Annual Report
Looking back at Tencent's valuation evolution in the past decade, a clear main line runs through it all: the valuation center gradually moves down