The "Golden September" market rally kicks off.
Nearly half of September has passed. To judge whether this year's "Golden September" will meet market expectations, we must first clarify how it kicked off.
Unlike previous years, the housing inventory for this year's "Golden September" was already scheduled in the property launch calendar at the end of August: 4,455 units in Shenzhen, 2,104 units in Xi'an, 1,705 units in Wuhan, and 306 units in Zhengzhou. The total estimated supply of these four comparable cities is 129.7% higher than the actual launch volume in August on a month-on-month basis; 7 projects in Guangzhou cover a total area of around 800,000 square meters, marking a 229% month-on-month increase. Four of the five cities have significantly expanded their supply, and the housing stock is fully prepared.
The demand side also sent signals in advance. Among the frontline forecasts for September from 13 key cities, 12 cities expect new home transactions to rise month-on-month, while second-hand home transaction expectations are universally positive, with no city predicting a decline.
Supply in place, conversion warming up, and pending transaction realization — this is the launch sequence of this year's "Golden September". But how far it can ultimately go, we need to look back at the market performance in August to find the answer.
01
Survey data from Puru Smart City Institution shows that the property launch intensity at the "Golden September" node has increased significantly. In terms of total volume, the total estimated supply of the four comparable cities of Shenzhen, Wuhan, Xi'an and Zhengzhou is 129.7% higher than the actual launch volume in August month-on-month; among them, Shenzhen ranks first with 4,455 units, Wuhan and Xi'an both have around 2,000 units, and Guangzhou's total estimated supply is about 800,000 square meters, a 229% month-on-month increase. Four of the five cities have expanded their supply, and the housing preparation for "Golden September" was completed at the end of August.
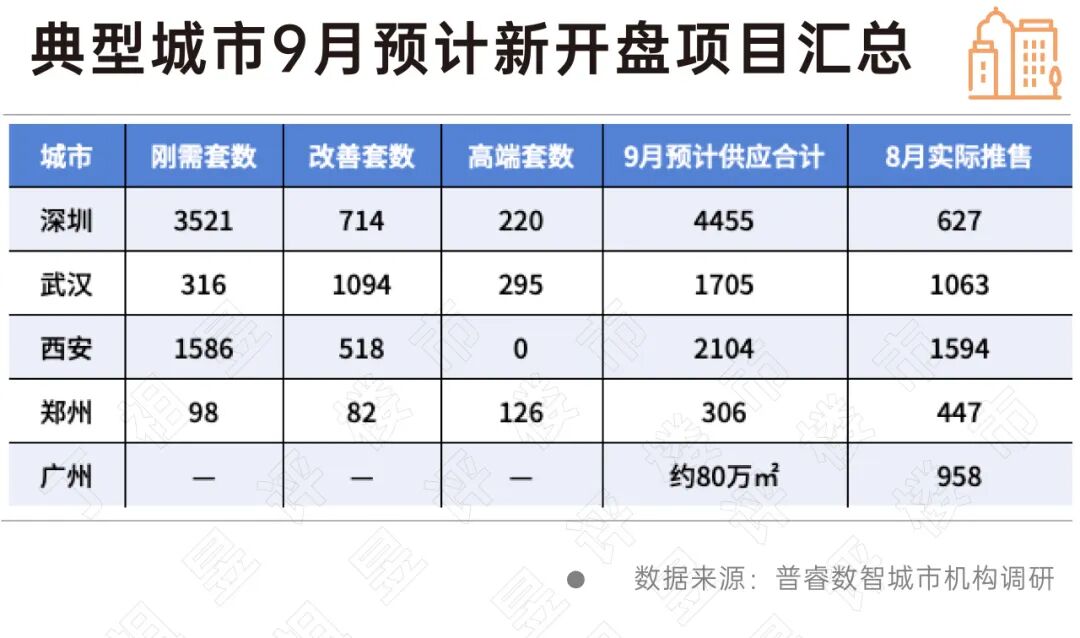
In terms of structure, affordable housing demand accounts for 64.4%, upgraded housing demand accounts for 28.1%, and high-end housing accounts for 7.5% in the four cities of Shenzhen, Wuhan, Xi'an and Zhengzhou, with affordable demand products taking up nearly two-thirds of the total.
Affordable demand housing is the absolute main force in Shenzhen, accounting for 79% with 3,521 units, which are concentrated in peripheral sectors including Shangtang, Dalang, Guanlan, Qinghu, Fucheng in Longhua, as well as Guangming and Pinghu in Longgang, with unit prices ranging from 35,000 yuan to 55,000 yuan per square meter. The scale of individual projects is generally large, including 569 units in Shenye Shangchen Ruifu, 567 units in Xinghe Xingyue Zunfu, 520 units in Zhongjiao Guorun Huafu, 496 units in the second phase of Shentie Longjing, and 462 units in Xishan Hexi Yufu; there are only 3 high-end projects with 220 units, all located in Hongshuwan, Houhai of Nanshan and Bao'an Center, with unit prices ranging from 145,000 yuan to 185,000 yuan per square meter.
The structure of Wuhan is just the opposite: upgraded housing accounts for 64.2% with 1,094 units, high-end housing accounts for 17.3% with 295 units, and affordable demand housing only accounts for 18.5% with 316 units, concentrated in Qingshan Binjiang, Guanggu Central City, Qintai Cultural District and Wuchang Binjiang. Xi'an has 1,586 affordable demand units, accounting for 75.4%. Although Zhengzhou only has 4 projects, all of them are 3.5-generation and 4th-generation new regulation products, of which high-end units account for 41% with 126 units, making it the only city among the five that is dominated by new regulation high-end products.
02
Whether the concentrated housing supply in September can be digested depends on the absorption capacity remaining from August.
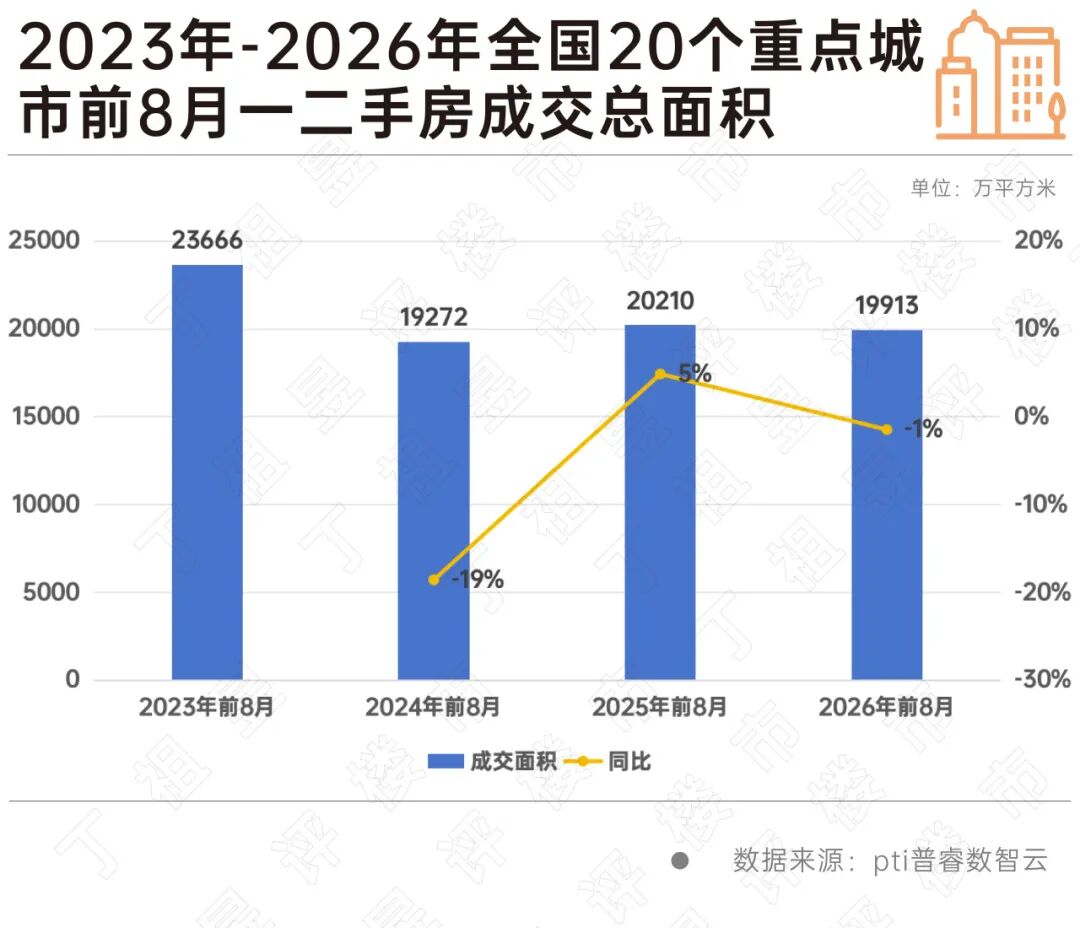
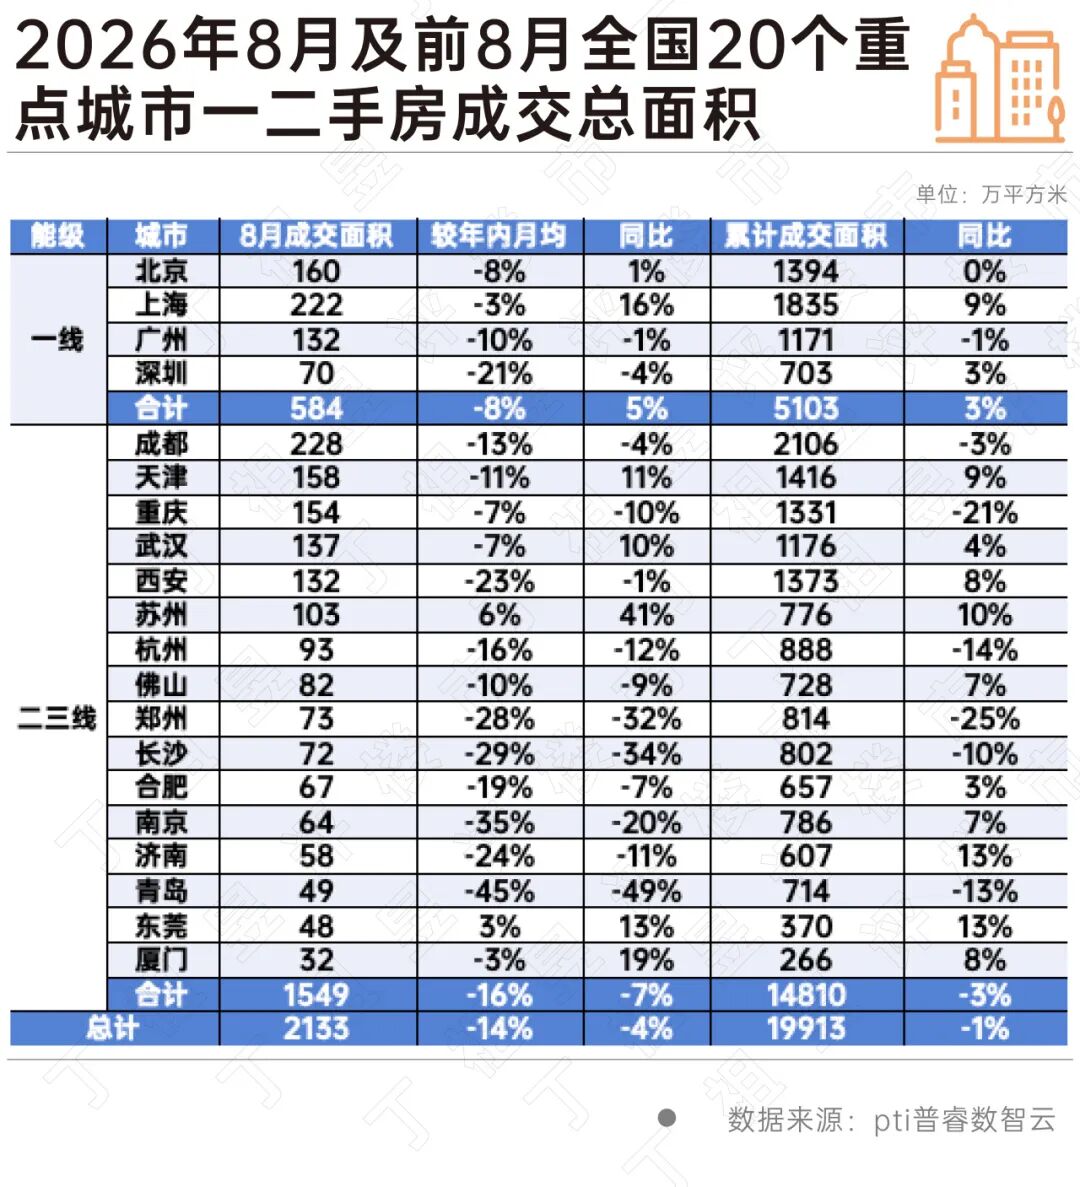
Judging from the overall data of August, the monthly performance is not satisfactory. According to the monitoring of Puru Smart Cloud by PTI, the total transaction area of new and second-hand homes in 20 key cities across the country is 21.33 million square meters, down 4% year-on-year, and 14% lower than the monthly average of 24.89 million square meters within the year. This is a standard off-season performance.
But if we extend the timeline, the conclusion is much more moderate. The cumulative transaction volume of the 20 cities in the first 8 months reached 199.13 million square meters, a slight drop of 1.5% year-on-year, still 3.3% higher than the same period in 2024. The significance of this data is that it is valid after the two traditional off-seasons of July and August. In other words, the downward adjustment of transaction scale in August is a seasonal fluctuation above the central operation platform, rather than the platform itself sinking. The transaction platform established since 2024 is more stable than it appears.
The divergence at the city level is more noteworthy than the total volume. Under the cumulative statistical caliber, 12 of the 20 cities have positive year-on-year growth, Beijing remains flat, and only 7 cities including Guangzhou and Chengdu have negative cumulative growth; 10 of the 16 second- and third-tier cities have positive cumulative growth, accounting for more than 60%. Under the monthly statistical caliber, 6 cities including Suzhou, Xiamen, Shanghai, Dongguan, Tianjin and Wuhan have a year-on-year growth rate of over 10%. Among them, the transaction volume of Suzhou in August was 1.03 million square meters, which not only rose 41% year-on-year, but also was 6% higher than the monthly average within the year, making it the only second-tier city that shows upward trends in both dimensions.
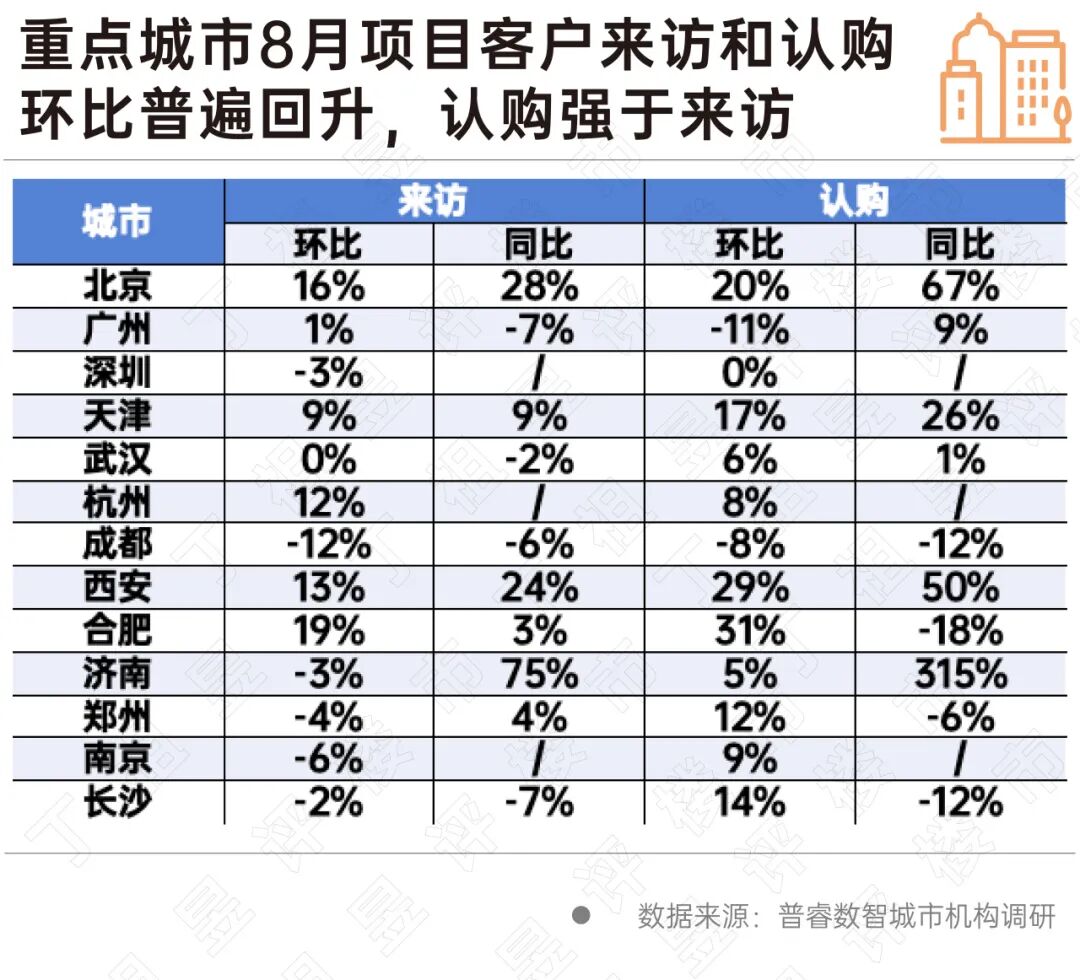
Visitor flow and subscription are leading indicators that come before transaction, both of which rose month-on-month in August. Among the 13 key cities, visitor flow increased in 6 cities, remained flat in 1 city and declined in 6 cities, with Hefei, Beijing, Xi'an, Hangzhou and Tianjin leading the growth; the widespread growth of subscription is significantly broader, with 10 cities rising, 1 city flat and 2 cities declining, and the month-on-month growth rate of 6 cities including Hefei, Xi'an, Beijing, Tianjin, Changsha and Zhengzhou exceeded 10%.
Subscription growth outpaces visitor flow growth, and this gap is the core key. If only the number of visitors rises, it is more like a natural seasonal recovery; but the wider scope of subscription growth and higher median value indicate that the conversion efficiency from visit to subscription is improving. Historically, when this kind of leading rise occurs while the total transaction volume is still at the low level of the off-season, it is usually a precondition for transaction recovery in the next month.
Under the year-on-year caliber, the asymmetric pattern of "a few cities surging sharply, most cities declining slightly" is clearer. Visitor flow increased in 6 cities and decreased in 4 cities, with the growth rate of Jinan, Beijing and Xi'an exceeding 20%; subscription also rose in 6 cities and fell in 4 cities, but the growth magnitude is far more significant. The year-on-year growth rate of Jinan, Beijing and Xi'an exceeded 50%, Tianjin increased by 26%, while the decline range of Hefei, Chengdu, Changsha and Zhengzhou on the decline side was all controlled within 20%. This pattern is a feature of the early stage of recovery, not the middle stage of recession.
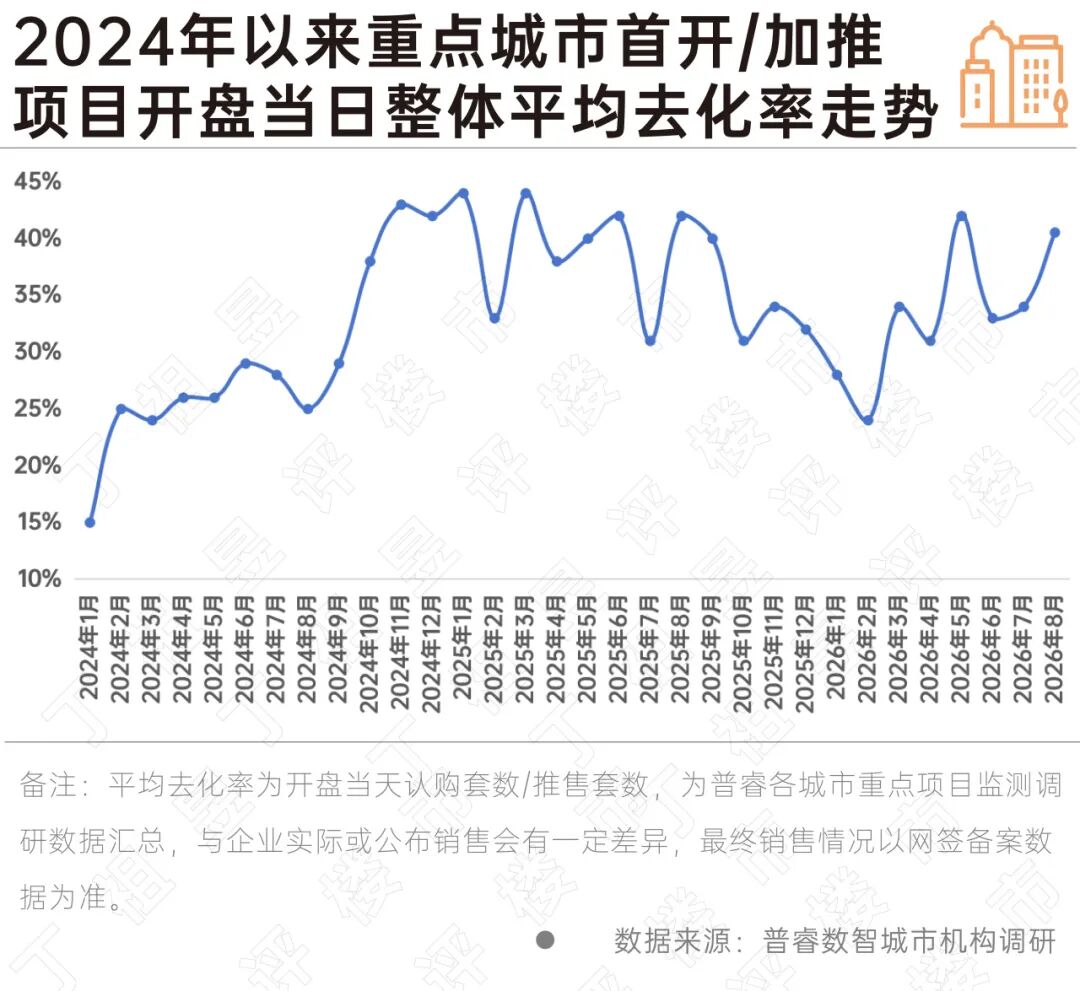
At the same time, from the project side, 162 projects in 17 key cities held their first opening or launched additional sales in August, with a total of 15,278 units for sale. The overall sell-through rate on the opening day was 41%, jumping 7 percentage points from July, which is the second highest value in 2026, second only to the 42% recorded in May.
The key point is that this recovery was achieved on the premise that the sales volume expanded by 69%. There were 9,018 units for sale in July with a 34% sell-through rate, and 15,278 units for sale in August with a 41% sell-through rate, and the number of projects also increased by 60%.
The simultaneous occurrence of volume expansion and market warming is a first in 2026.
In other words, real estate enterprises have concentrated their resources on projects with more certain sales performance, and customers have indeed followed suit. Looking at the 32 months since 2024, 41% is significantly higher than the median of 33%, making it the 10th month that the sell-through rate has exceeded 40%.
03
We define projects with a sell-through rate of 70% or above on the opening day as "hot-selling projects". In August, there were 21 hot-selling projects with a sell-through rate of over 70%, with a total of 2,788 units for sale and 2,512 units subscribed. They share four common characteristics.
First, affordable and upgraded demand projects dominate the hot list, while the high-end sector shows two extreme trends. 92 affordable housing projects have a total of 8,860 units for sale and 3,642 units subscribed, with an average sell-through rate of 41%, contributing 13 hot-selling projects; 30 high-end projects have 1,765 units for sale and 626 units subscribed, with a sell-through rate of 35.5%, contributing only 5 hot-selling projects. High-end projects are further diverging: 8 high-end projects in first-tier cities have a sell-through rate of 52.8%, while 22 high-end projects in second-tier cities only have a 26.1% sell-through rate, 14 of which are below 30%. The high-end sector in first-tier cities relies on non-replicable location scarcity, while high-end projects in second-tier cities rely more on premium from upgraded housing. Before local housing price expectations stabilize, they cannot find sufficient market absorption capacity.
Second, the window dividend of first opening is still expanding. 31 first-opening projects have 4,724 units for sale, with a sell-through rate of 56.5% on the opening day; 93 additional-launch projects have 6,304 units for sale, with a sell-through rate of only 29.1%. The gap between the two is 27.4 percentage points, further widened from July. 12 of the 21 hot-selling projects are first-opening, and 5 of the 7 projects that were sold out on the opening day are first-opening. This means that the marginal benefit of "small batches with multiple launches, small-step fast iteration" is declining, and the success of the first opening has a greater impact on the full cycle of the project than in the past.
Third, the leading edge of new regulation products is nearly double. 29 projects marked as new regulation products have 3,387 units for sale, with a sell-through rate of 56.3%; 18 non-new regulation projects have 1,753 units for sale, with a sell-through rate of 28.7%, a gap of 27.6 percentage points. Improvements in specifications such as high usable floor area ratio, large width, and fourth-generation housing are translating into a visible subscription rate gap on the opening day, and 9 of the 21 hot-selling projects are clearly new regulation products.
Fourth, hot-selling products continue to concentrate on large apartment sizes. The main apartment size of the 21 hot-selling projects is generally above 120 square meters, and the best-selling projects in second-tier cities are also dominated by 4-bedroom and 5-bedroom units. Calculated based on the main apartment size and unit price, the total price range of hot-selling projects in first-tier cities is concentrated between 6.5 million yuan and 14 million yuan, top luxury projects in first-tier cities are between 23 million yuan and 86 million yuan, and upgraded hot-selling projects in second-tier cities including Hangzhou and Tianjin are between 2.4 million yuan and 5.7 million yuan. None of them are traditional small-sized affordable housing projects.
Further analysis of the projects that were sold out on the opening day includes Greentown · Yuhaitang, Jinmao Manyu, Xiangyu Jinmao · Manjia, Baoye · Hongqiao Guanjianli in Shanghai, the second phase of China Merchants Xu in Changsha, and Dajia Wenyue Junlu and Binjiang Ming'ao Fu in Hangzhou. Four of them are located in Shanghai, basically following the path of launching large-sized products at the unit price level of affordable housing.
Compared with the supply in September, two-thirds of which are affordable demand products, it exactly matches the pattern that affordable and upgraded demand projects dominate the hot list. In addition, first-opening projects, new regulation products, and large-sized products at affordable housing unit prices will likely continue to become the portrait of the first batch of hot-selling projects in September.
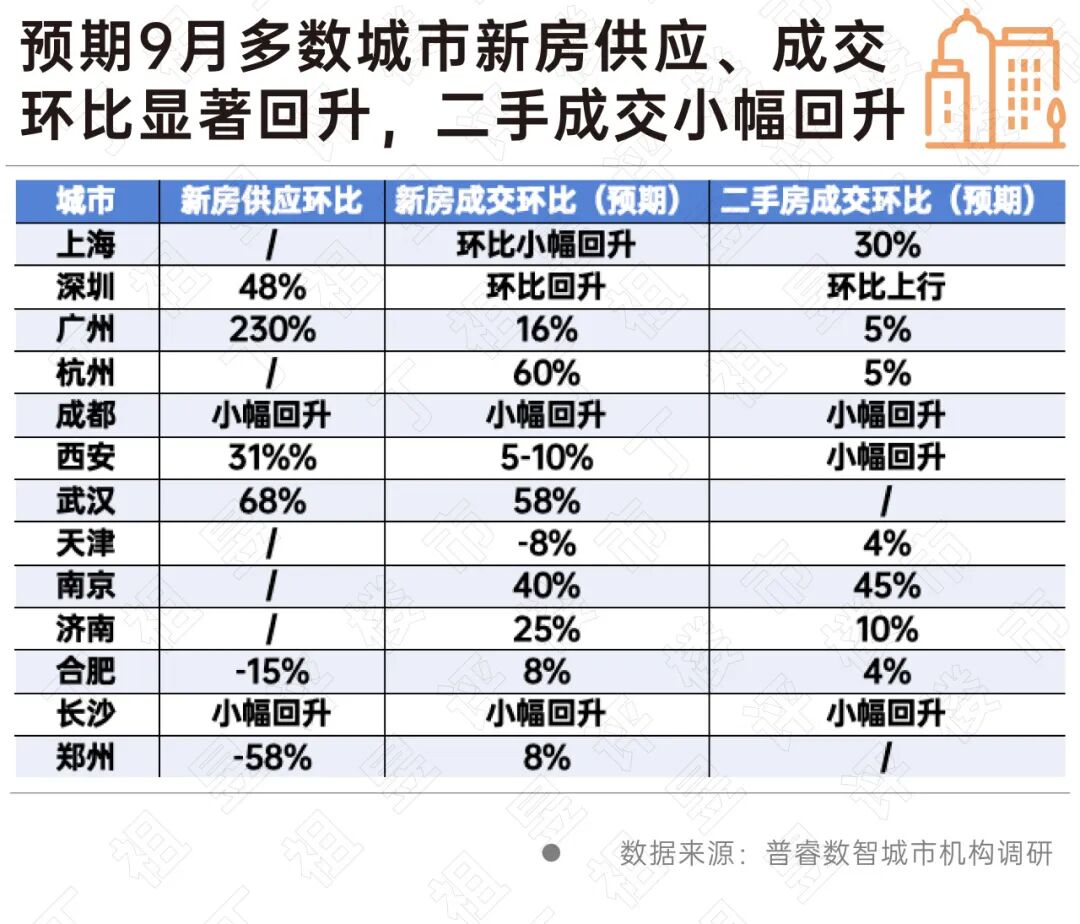
The frontline analysts of Puru Research covering 13 key cities have quite consistent judgments on September. Clear positive signals have emerged on the supply side: the supply preparation for "Golden September" is already in place, and it is concentrated in first-tier and strong second-tier cities. The transaction forecast is optimistic. Among the 13 cities, 12 expect new home transactions in September to rise month-on-month, and only Tianjin expects a month-on