Why are we increasingly reluctant to take the bus?
Today is Monday. Let me ask you a question: How did you get to the company today, by subway, driving, taking a taxi or cycling?
Some of you may notice that there is no bus option in this question.
Multiple sets of data show that for many young people living in first- and second-tier cities, buses have seemingly become a "forgotten" travel option.
So here comes the question: Why are we increasingly reluctant to take buses?
01 Yes, buses have lost their business to subways
The fact that people are taking buses less and less is not an illusion caused by survivorship bias, but a reality supported by data.
Search for urban transportation reports in China over the past 10 years, and you will find a striking consistent trend: bus passenger volume has been declining continuously, while subway passenger volume has been rising steadily.
Take the famous Route 300 in Beijing as an example to see how the passenger volume of buses in big cities has declined in the past decade.
Route 300 is a main bus line connecting all sections along the Third Ring Road in Beijing, with 4 routes including inner loop, outer loop and supporting express lines (hereinafter referred to as Route 300). It is no exaggeration to call it the main artery of Beijing's ground public transport.
In 2007, the total passenger flow of Route 300 once set a historical record of carrying 300,000 passengers per day.
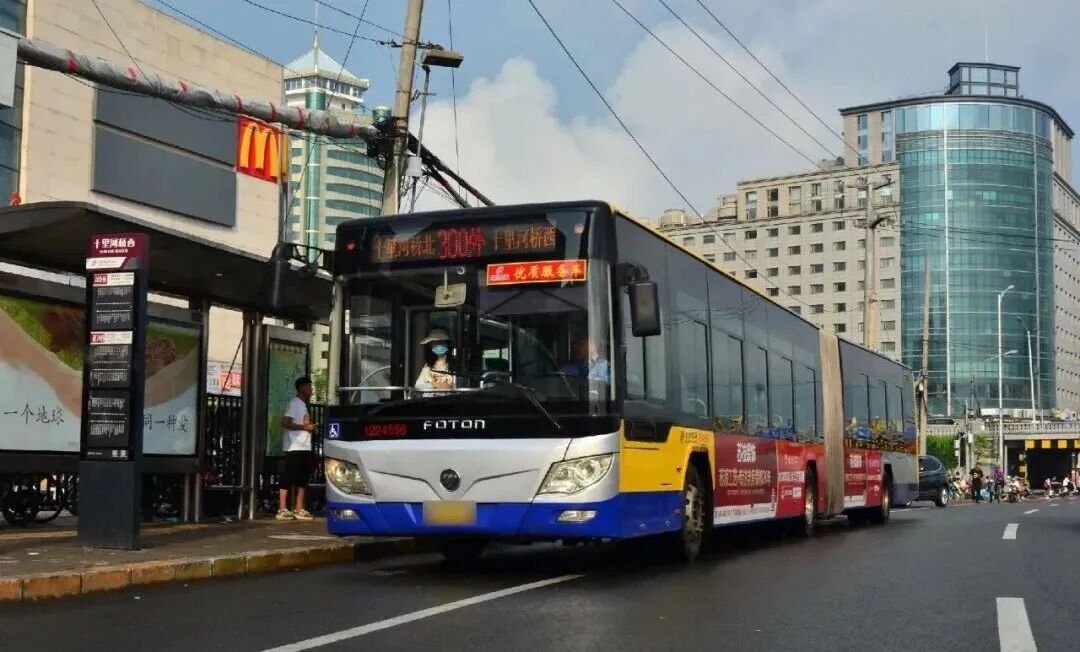
Source from the Internet: Large bus of Beijing Route 300
At that time, during peak hours on workdays, it was normal for an 18-meter articulated bus to squeeze in more than 200 passengers. Taking Route 300 made passengers very nervous: they worried about not being able to get on the bus when waiting, and worried about not being able to get off when arriving at the stop after squeezing on.
In 2025, this figure dropped to 80,000 to 100,000 passengers per day, down two-thirds from the peak value in 2007. Route 300 once had more than 260 buses during peak hours, but now the number has been reduced to 120.
The reason for this situation is that the rapid development of Beijing's subway has diverted the passenger flow of Route 300, such as Beijing Subway Line 5 and Line 12.
2007 was the peak of Route 300, but it also started to go downhill from that year, because Subway Line 5 was opened to traffic that year.
But the most influential one is Subway Line 10, which opened in 2013. In the year of its opening, the average daily total passenger flow of Route 300 plummeted from 200,000 to 250,000 person-times in the previous year to about 100,000 person-times, which can be described as a cliff-like decline.
No wonder, this "half Third Ring Road" Subway Line 10 is almost an underground Plus version parallel to Route 300. It can cover all the areas that Route 300 can reach, and it can also cover areas that Route 300 cannot reach. It not only runs faster, but also is more convenient for transfer, so it immediately became a new choice for commuters after opening.
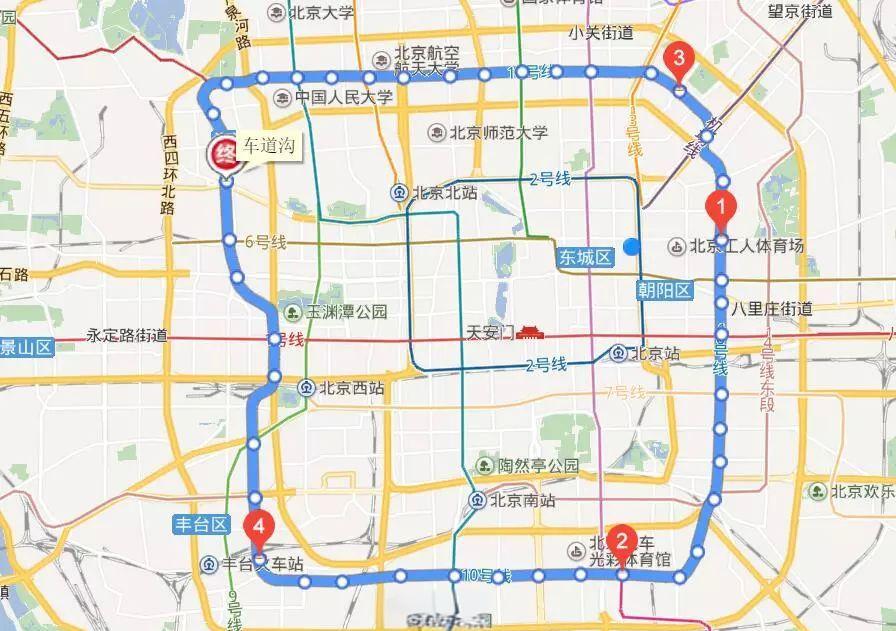
Source from the Internet: Beijing Subway Line 10 has a high overlap with Route 300
Route 300 is just a microcosm of the dilemma of many bus lines in Beijing, or the most intuitive typical case.
According to a set of data, the operating mileage of Beijing subway was 142 kilometers in 2007; this figure rose rapidly to 442 kilometers in 2012; as of August 2026, the latest data shows that the total operating mileage of Beijing subway is about 909 kilometers. In 20 years, the operating mileage of Beijing subway has increased by 5.4 times.
With the continuous extension of operating mileage and the enhancement of network effect, the annual passenger volume of Beijing subway has also grown rapidly. It was only 700 million person-times in 2007, and surpassed buses for the first time in 2017, reaching 3.778 billion person-times, thus becoming the main force of Beijing's public transport. In 2019, the annual passenger volume of Beijing subway hit a new high of 3.96 billion person-times, even ranking first in the world in annual subway passenger volume.
In recent years, due to the epidemic, industrial transfer and other reasons, although the annual passenger volume of Beijing subway has declined, it still remains at a high value of more than 3.5 billion person-times.
According to the "Statistical Communiqué on National Economic and Social Development of Beijing in 2025", the annual passenger volume of Beijing subway in 2025 fell slightly to 3.57 billion person-times year on year, while the passenger volume of Beijing buses fell 23.81% year on year to 1.6 billion person-times, which is only equivalent to 44.74% of the subway passenger volume.
Beijing is not an isolated case. The similar phenomenon of declining bus passenger volume and rising subway passenger volume is very common in large and medium-sized cities in China. Even in cities where subways were opened later, the trend remains the same.
Nanchang's first subway was opened at the end of 2015, and its annual passenger volume surpassed that of buses in only 6 years. Taking the latest available data of 2024 as an example, the bus passenger volume of Nanchang that year was 193 million person-times, and the subway passenger volume was 439 million person-times, the former is only equivalent to 44% of the latter.
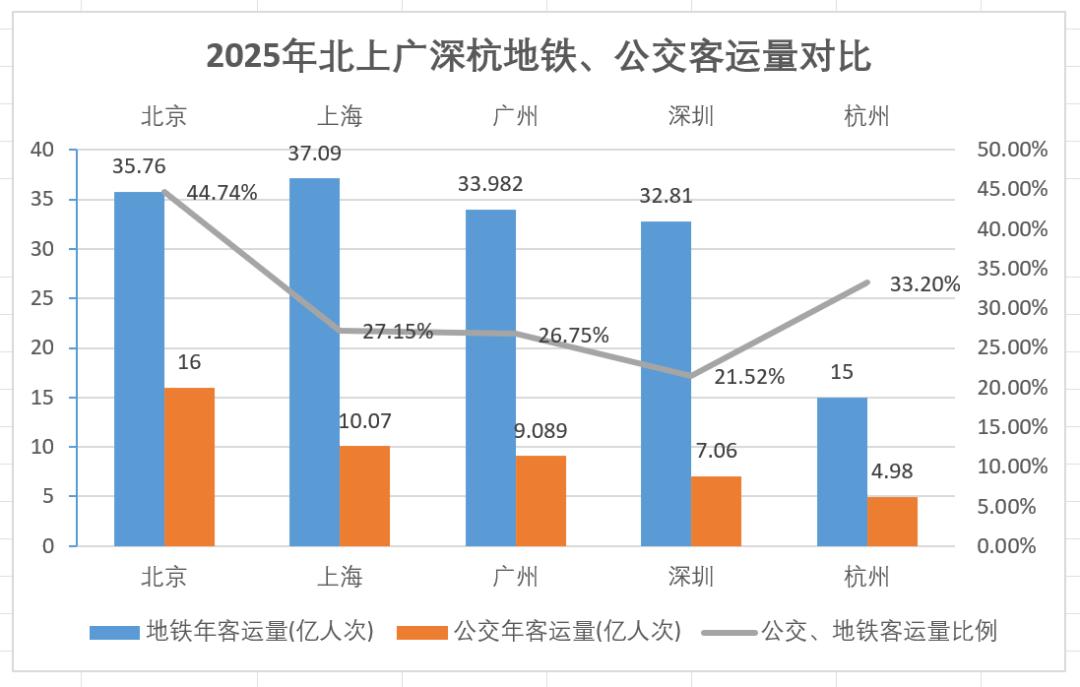
In fact, the proportion of bus and subway passenger volume in Beijing and Nanchang is relatively high, and that in other cities is much lower.
Data from 2025 shows that the passenger volume of subway and bus in Hangzhou in 2025 was 1.5 billion person-times and 498 million person-times respectively, and the proportion of bus passenger volume to subway passenger volume was only 33.2%.
Shanghai is another city whose proportion has dropped below 30%. In 2025, the passenger volume of subway was about 3.716 billion person-times, and the passenger volume of buses was about 1.007 billion person-times, which is only equivalent to 27% of the former; while in Shenzhen, the subway passenger volume was about 3.281 billion person-times, and the bus passenger volume was about 706 million person-times, which is only equivalent to 21.52% of the former.
Compared with buses, subways have overwhelming advantages in long-distance commuting (more than 10 kilometers): punctual, fast, and not affected by traffic lights.
When it comes to ultra-long-distance commuting, buses no longer even have the only advantage of low price.
Take Beijing as an example: the bus fare is 2 yuan for within 10 kilometers, and 1 yuan for every additional 5 kilometers beyond that; while the starting fare of subway is 3 yuan for 6 kilometers, 4 yuan for 6-12 kilometers, 5 yuan for 12-22 kilometers, 6 yuan for 22-32 kilometers, and 1 yuan for every additional 20 kilometers beyond 32 kilometers.
That is to say, within 20 kilometers, buses are 1-2 yuan cheaper than subways; but when it exceeds 20 kilometers, the bus fare is equivalent to the subway fare; when it exceeds 30 kilometers, the bus fare is even more expensive than the subway fare. Even without considering the riding experience and traffic efficiency, passengers' choice is obvious.
Obviously, there is an obvious substitution effect between buses and subways. Once the subway lines form a network, people who originally relied on medium and long-distance bus lines will quickly shift to the subway.
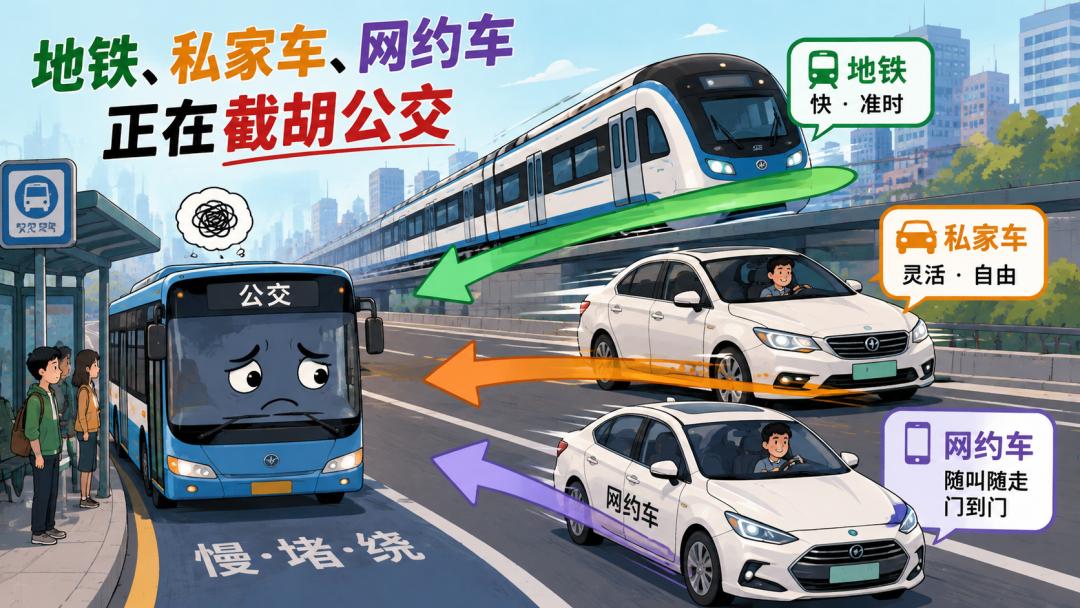
02 Not only subways, private cars and ride-hailing services are also diverting bus passengers
It is true that subways have diverted bus passenger flow, but it is one-sided to attribute the decline of bus passenger volume to the expansion of subways, because private cars and ride-hailing (including online car-hailing and taxis, the same below) are also squeezing the living space of buses.
First talk about private cars. It is actually a very easy-to-ignore travel mode, so that many cities do not even count its data, including big cities like Shanghai and Shenzhen.
In 2025, the number of private cars in China reached 323 million, an increase of about 2.24 times compared with 144 million in 2015; the number of private cars rose from 88 million to 187 million, doubling in 10 years.
If you buy a car, you will drive it naturally. The increase in ownership means the growth of private car travel trips. Since private car travel cannot have accurate data records like buses and subways, it can only be estimated, and the estimated results vary greatly.
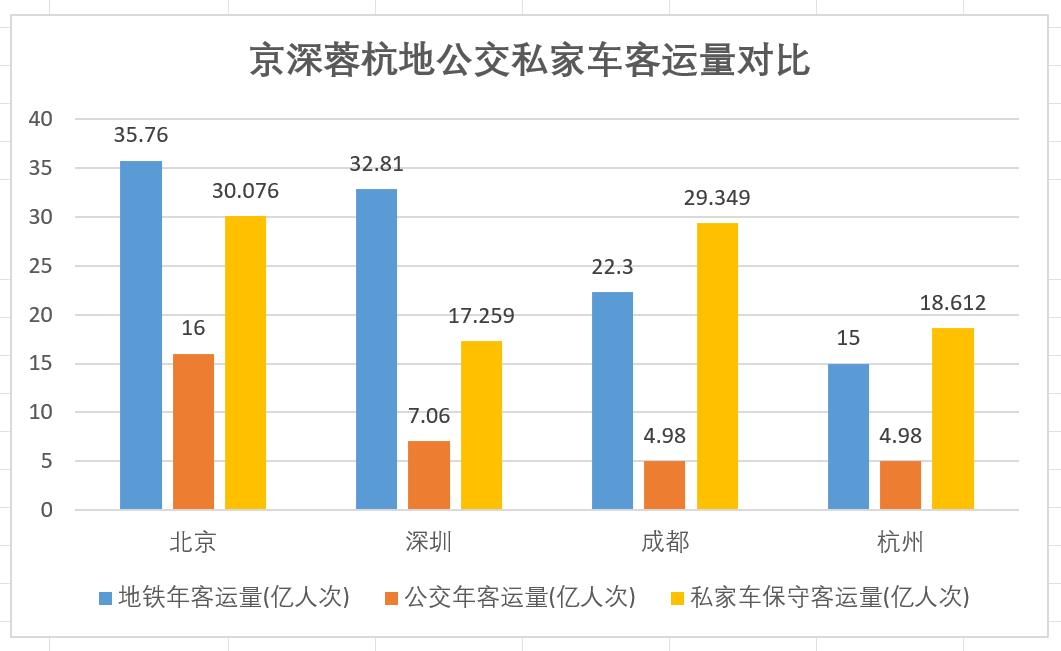
According to the "2026 Beijing Annual Report on Transportation Development" released by Beijing Transport Institute, the average daily travel volume of small passenger cars in 2025 was 8.24 million person-times, and the annual travel volume calculated based on this is about 3.0076 billion person-times, which is lower than 3.576 billion person-times of subway, but higher than 2.09 billion person-times of buses.
The "2025 Beijing Annual Report on Transportation Development" released the year before provides another calculation method. At the end of 2024, the number of private motor vehicles in Beijing was 6.496 million, with an average of 3.37 trips per workday.
Based on this conservative calculation (only counting workday trips, and 1 person per trip), that is, the private car travel volume in Beijing in 2024 = 6.496 million * 248 workdays * 3.37 trips per car, it is not difficult to calculate that its annual passenger volume is at least 5.429 billion person-times, which is definitely the number one travel mode in Beijing.
According to comprehensive official data, by the end of 2025, the number of private cars in Shenzhen, Chengdu and Hangzhou was 3.7278 million, 6.339 million and 4.02 million respectively.
Calculated according to the formula of "2026 Beijing Annual Report on Transportation Development", the private car travel volume of Shenzhen, Chengdu and Hangzhou in 2025 will be 3.116 billion person-times, 5.298 billion person-times and 3.36 billion person-times respectively, which are far higher than the subway and bus travel volume of the city, ranking first steadily.
Even according to the algorithm of "2026 Beijing Annual Report on Transportation Development" (approximately equal to 55.4% of the 2025 algorithm result), the number of private car travelers in each city can easily exceed the bus passenger volume.
Compared with buying cars, young people nowadays seem to prefer taking taxis more.
Take Shenzhen with a large number of young people as an example. According to the "Statistical Communiqué on National Economic and Social Development of Shenzhen in 2025", the passenger volume of online car-hailing in 2025 was 558 million person-times plus 236 million person-times of taxi passenger volume, the annual taxi travel trips reached 794 million person-times, while the bus passenger volume was only 706 million person-times.
The situation in Guangzhou is similar. According to the "2025 Guangzhou Annual Report on Transportation Development", the average daily passenger volume of subway, bus, taxi and online car-hailing in Guangzhou in 2025 was 9.31 million, 2.49 million, 580,000 and 2.67 million respectively, converted into annual passenger volume of 3.3982 billion person-times, 908.9 million person-times, 211.7 million person-times and 974.6 million person-times respectively. Only the online car-hailing item exceeds the passenger volume of buses.
There is also Hangzhou. Official data shows that its subway and bus passenger volume in 2025 was 1.5 billion person-times and 498 million person-times respectively. The clearly available data of online car-hailing is 176 million person-times in Q1 and 200 million person-times in Q2. The estimated annual data is no less than 576 million person-times (the second half of the year is the peak season), and the number of people traveling by taxi also exceeds that of buses.
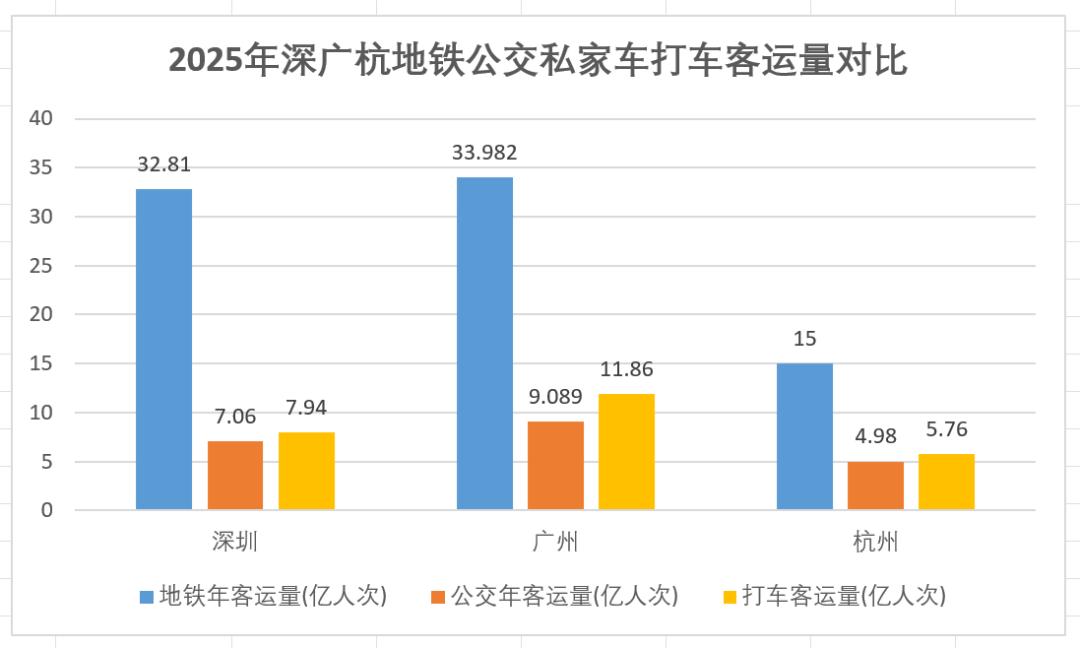
For people who pursue comfort and time efficiency, the convenience of online car-hailing and the "point-to-point" door-to-door service are obviously more attractive than buses that stop at every station.
Compared with 10 years ago, the income level of citizens has been greatly improved. At the same time, the increase in the supply of online car-hailing in recent years has led to a drop in prices, making