Buffett's successor's Q2 scorecard: he purchased $20 billion worth of stocks and earned a profit of $25.667 billion.
On August 8, 2026, Berkshire Hathaway released its 10-Q financial report for the second quarter and the first half of the year.
This is the second heavyweight performance report delivered by Greg Abel after he fully took over as CEO, and it also marks the moment when the company's 14-consecutive-quarter cycle of net stock selling was broken.
In the second quarter, Berkshire bought a net $20 billion worth of stocks, of which $10 billion was invested in Alphabet through private placement.
In the same quarter, the scale of share repurchases jumped from $234 million in the first quarter to $4.5 billion. Core operating profit reached $12.983 billion, a year-on-year increase of 16.3%, exceeding Wall Street's previous expectation of $10.8 billion. Net profit attributable to shareholders was $25.667 billion in the second quarter and $35.773 billion in the first half of the year.
Behind the numbers lies a bigger question: After Buffett stepped down to the position of chairman, can Berkshire still convert its huge cash and cash flow into effective capital allocation as it has done in the past few decades? The second-quarter financial report gives the most direct answer so far.
The cash hoard has finally been put into motion
Berkshire has long held a huge sum of money on its books.
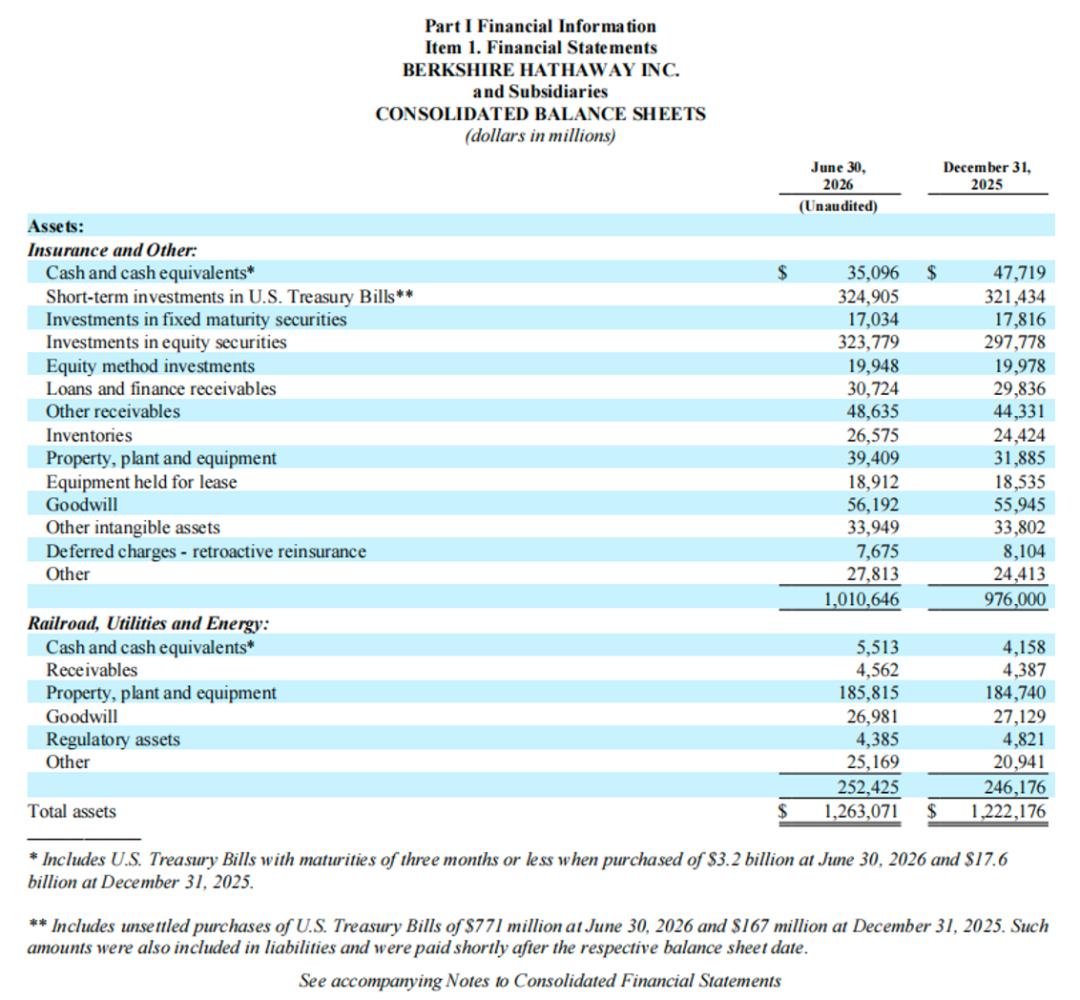
As of June 30, Berkshire's cash and cash equivalents stood at $35.096 billion, and its short-term U.S. Treasury investment reached as high as $324.905 billion. After deducting $771 million of unpaid Treasury purchases that have not yet been settled, the net amount of core liquid assets is approximately $359.2 billion.
This figure has seen a rare substantial drop from nearly $397.4 billion at the end of the first quarter. Capital has been transferred from interest-bearing Treasury bonds to buy stocks and acquire companies.
The most significant allocation in the second quarter's capital deployment was Berkshire's $10 billion strategic investment in Alphabet via private placement.
At that time, Alphabet announced an $80 billion total equity financing plan, including a $300 billion underwritten public offering and a $400 billion ATM program, to support its capital expenditure of $180 billion to $190 billion in 2026, which is mainly invested in the expansion of AI computing infrastructure.
Berkshire stepped in precisely in this round of financing, buying $5 billion of Class A shares at $351.81 per share, and another $5 billion of Class C shares at $348.20 per share.
This is not an isolated purchase. Combined with continuous accumulation of positions in the secondary market from the third quarter of 2025 to the first quarter of 2026, Alphabet has jumped to become Berkshire's fifth largest heavyweight stock. The top four are Apple, American Express, Bank of America and Coca-Cola respectively, with Chevron, which has been continuously reduced, being pushed out of the ranking. At present, the top five heavyweight stocks account for about 66% of the entire stock investment portfolio.
This investment breaks the stereotype that Berkshire never touches tech stocks with complex underlying logic. Abel's logic is not complicated. In the AI era, data centers, computing power and underlying large models have evolved into new public utilities of the modern national economy.
Just as Berkshire bet heavily on BNSF Railway and BHE power grids in its early years, heavy investment in Alphabet's AI infrastructure is essentially a bet on the underlying lifeline of the digital economy for decades to come. Alphabet's debt-to-equity ratio of 0.16 and a reasonable forward price-earnings ratio of 23 to 26 times also provide a sufficient margin of safety.
Outside the secondary market, Berkshire has also made moves in control acquisitions in the real economy. Following the completion of its $9.7 billion acquisition of OxyChem under Occidental Petroleum on January 2, it announced at the end of May that it would officially complete the full acquisition of residential homebuilder Taylor Morrison Home Corporation for approximately $6.8 billion in cash at a price of $72.50 per share on July 24.
This acquisition will be integrated into the existing building products segment, and together with Clayton Homes and Johns Manville, will generate synergies in procurement, building material supply and mortgage financial services.
Share repurchase is the other leg of the strategy. In the second quarter, Berkshire spent $4.5 billion repurchasing its own shares, with Class A share repurchase prices ranging from $716,000 to $733,000, and Class B share prices ranging from $476 to $488.
In accordance with Berkshire's established policy, share repurchases can only be initiated when both the CEO and Chairman Buffett believe that the stock price is conservatively estimated to be significantly lower than the intrinsic value, and the combined cash is not less than $30 billion. The repurchase scale in the first quarter was only $234 million, which surged to $4.5 billion in the second quarter, and the high-intensity pace continued in July.
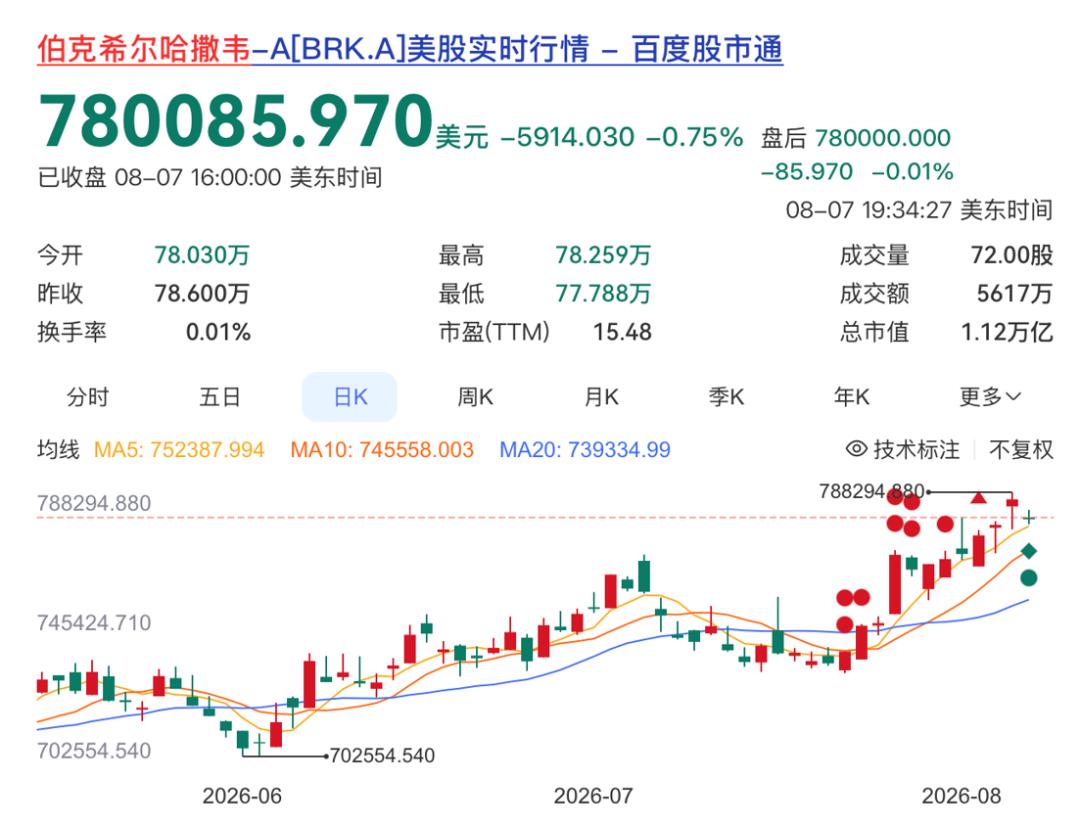
Against the current market capitalization of over $1.1 trillion and a price-to-book ratio of about 1.5 times, this move is equivalent to the management showing their cards: they believe the current pricing has an obvious discount. This mechanical repurchase accompanied by high cash flow objectively builds an invisible support line for the stock price in the secondary market, which the market calls the "Abel put option".
Chassis and engine
Abel dares to make so many large capital allocations at the same time in the second quarter, supported by the performance reports handed over by various business segments.
The Manufacturing, Services & Retail (MSR) segment was the biggest contributor to this quarter's better-than-expected earnings, with an after-tax profit of $4.47 billion, a sharp year-on-year increase of 24.1%. Pre-tax profit from industrial manufacturing surged 41.0% year-on-year in the second quarter and 32.2% in the first half of the year.
Precision Castparts benefited from the recovery of demand in the aerospace and industrial gas turbine sectors and cost pass-through price hikes, with its revenue rising 11.4% in the first half of the year.
Lubrizol and IMC passed on raw material and supply chain costs through price increases, with IMC's pre-tax profit jumping 56.6%. OxyChem, which was consolidated on January 2, contributed $2.6 billion in revenue and $121 million in pre-tax profit in the first half of the year.
In the retail segment, after last year's restructuring and asset disposal, Pilot Travel Centers saw its profit rebound 143.7% year-on-year to $290 million in the second quarter driven by profit release from fuel price derivative contracts and gross margin improvement, making it the biggest highlight of the retail sector.
TTI recorded a 26.5% surge in revenue in the first half of the year as customers accelerated procurement over concerns about supply chain disruptions. NetJets posted 15.5% growth driven by increased flight hours and unit prices.
On the building products side, home sales revenue at Clayton Homes declined slightly due to high interest rates, but the financial services segment saw significant profit growth benefited from an average loan balance of $30.4 billion and higher interest rate levels.
The BNSF railway segment posted after-tax profit of $1.558 billion in the second quarter, up 6.3% year-on-year, with operating revenue rising 14.6% to $6.601 billion.
The recovery of freight volume is the core driving force. Consumer goods transport volume rose 9.3% in the single quarter benefited from increased west coast imports and tight trucking capacity. Agricultural and energy product transport volume soared 11.5% driven by grain exports and oil fuel demand. Coal transport volume continued to shrink by 7.9% due to lower natural gas prices and power plant decommissioning, but this was offset by higher per-car yield and fuel surcharge adjustments. The release of operating leverage further illustrates this trend.
Fuel expenses skyrocketed 68.1% year-on-year to $1.173 billion due to rising oil prices and increased transport volume, but the dominant compensation and welfare expenditure of $1.398 billion only increased slightly by 1.9%, indicating that underlying productivity is improving. The effective income tax rate in the first half of the year rose 2.9 percentage points year-on-year to 24.4%, partially weakening the net profit growth.
The BHE energy segment recorded net profit of $891 million in the second quarter, a sharp year-on-year increase of 26.9%.
Electricity profit margins in the U.S. utilities sector grew 8.1% and 5.4% in the second quarter and the first half of the year respectively, driven by retail electricity price hikes in some territories, lower thermal power generation costs, and production tax credits from renewable energy projects, which brought in $763 million in income tax benefits alone in the first half of the year. The natural gas pipeline business saw its net profit rise 26.4% in the first half of the year, driven by the advancement of rate cases and rising LNG demand brought by cold weather.
However, a sword hangs over BHE. Its subsidiary PacifiCorp is mired in litigation in Oregon and California related to fires such as the 2020 Santiam Canyon fire and the 2022 McKinney fire, with cumulative potential losses reaching $2.85 billion as of June 30.
In April this year, the Oregon Court of Appeals overturned the first-phase ruling in the James case, finding that the trial court made biased errors in jury instructions, but the plaintiff has appealed to the Oregon Supreme Court. Oral arguments are scheduled for November, and PacifiCorp has been forced to post a $719 million bond.
In another antitrust litigation over real estate brokerage commissions, the $250 million national settlement agreement previously reached by HomeServices is still in its four-year payment period. As of the end of June, $130 million has been paid off, and the remaining amount is pending final confirmation from the U.S. Federal Court of Appeals.
The two sides of the insurance segment best illustrate the situation.
As of June 30, total insurance float climbed to $177.5 billion, an increase of $1.1 billion from the end of 2025, which is the underlying ammunition for Berkshire's cross-cycle investment.
However, on the income statement, underwriting profit in the second quarter fell 13.1% year-on-year to $1.731 billion, with GEICO as the main drag. Premium income reached $11.291 billion, but the combined cost rate deteriorated from 71.8% to 76.6%. The frequency of personal injury claims increased by 5% to 7%, the frequency of property damage and collision claims rose by 3% to 5%, the average severity of personal injury claims surged 10% to 12% year-on-year, and underwriting expenses skyrocketed 27.3% year-on-year to $1.653 billion due to higher commission and advertising spending.
Such figures have led the market to worry that GEICO is losing its advantages in pricing and customer acquisition in competition with Allstate and Progressive.
In sharp contrast to GEICO's weakness are BH Primary and BHRG. There were no major disaster losses such as the $1.1 billion Southern California wildfire that occurred in the same period last year in the first half of the year, and the primary insurance loss ratio improved significantly. BHRG recorded $913 million in pre-tax underwriting profit in the second quarter, with the property/casualty reinsurance loss ratio dropping sharply by 5.3 percentage points.
In the second quarter, BHRG also signed a ten-year quota share reinsurance agreement with a wholly owned insurance subsidiary of Tokio Marine, which brought in $483 million in new premiums in the single quarter, demonstrating Berkshire's ability to use its own balance sheet to underwrite huge customized risks globally.
Insurance investment income fell 9.1% year-on-year to $3.059 billion in the second quarter due to the downward shift in the central level of short-term interest rates, but with its $324.9 billion Treasury position, it still stably generated $5.738 billion in net investment income in the first half of the year.
1.2873 Trillion USD
Berkshire's asset structure is becoming more and more complex, and its book net profit fluctuates sharply because GAAP requires unrealized gains and losses on stock investments to be directly included in the income statement. Simply looking at the price-earnings ratio or price-to-book ratio can hardly clarify how much it is really worth.
Institutions like Chris Bloomstran's Semper Augustus generally use the sum-of-the-parts (SOTP) method to value Berkshire.
Calculate each asset segment separately.
The net amount of cash and short-term Treasury bonds is $359.2 billion, which is recorded at 1:1 at face value as a credit-risk-free liquid asset. The fair value of publicly traded stock investments is $323.779 billion, and equity-method investments (mainly Kraft Heinz and Occidental Petroleum) are approximately $19.948 billion, but these parts cannot be simply added together.
The historical cost of the stock portfolio is only $106.521 billion, with unrealized gains as high as $217.258 billion. Taxes are required to be paid once these positions are liquidated or adjusted in the future, so a discount needs to be applied to these unrealized gains based on a deferred income tax liability of approximately 21%. After deducting the drag of this hidden tax item, the actual net value of the public market equity portfolio is about $278.155 billion, which adds up to about $298.1 billion together with equity-method investments.
On the wholly-owned subsidiary side, BNSF's net profit in the first half of the year was $2.935 billion, with an annualized amount of about $5.8 billion to $6 billion. Referring to peers such as Union Pacific and applying a price-earnings ratio of 18 to 20 times, its independent valuation should be between $105 billion and $115 billion. BHE's net profit in the first half of the year was $2.005 billion, with an annualized amount of about $4 billion. Despite the discount pressure from wildfire litigation, applying the usual 15 times price-earnings ratio for the utilities sector, its conservative valuation is between $60 billion and $65 billion.
The MSR segment contributed $7.669 billion in net profit in the first half of the year, with an annualized amount of over $15 billion. Referring to the 15 to 18 times valuation center of the diversified industrial and consumer goods sector, its intrinsic value is approximately $240 billion to $260 billion.
The insurance segment is the most flexible. The $177.5 billion float has a negative cost on the premise of long-term underwriting profitability. Coupled with the franchise value of the underwriting business itself at an annualized amount of about $7 billion, using a hybrid model that combines price-earnings ratio and float discount, its overall valuation is at least between $220 billion and $250 billion.
Adding these segments conservatively and subtracting approximately $20 billion of non-operating unsecured debt at the parent company level, the resulting intrinsic value is about $1,287.3 billion, which is more than $1.28 trillion.
Compared with the total market capitalization of approximately $1.12 trillion to $1.15 trillion in early August 2026, the current stock price is still in a discount range, implying a margin of safety of about 10% to 12%.
Some aggressive Wall Street analysts' high-end valuation expectations derived from excess return models even exceed $1.5 trillion. This arithmetic is exactly the mathematical basis behind the $4.5 billion repurchase in the second quarter.
What the market thinks
Looking through the financial reports and valuation models, global institutional funds buying and selling Berkshire in the secondary market are actually trading several layers of superimposed logic.
The most