Is earning 1 million US dollars a day not enough for new games launched in 2026? The median revenue of one specific game category has reached 4.3 million US dollars.
After a mobile game is launched, how long does it take to earn its first 1 million US dollars?
For many new games, this may be a critical milestone to verify their commercialization capability. But if we extend the observation timeline, the answer may be unexpected: some games exceed 1 million US dollars in revenue just one day after launch, while others take nearly five months; for those products with a slower start, the revenue they generate later can be even higher.
A recent study published by AppMagic tracked 158 mobile games launched in 2026 that had accumulated over 1 million US dollars in in-app purchase revenue as of October 17. Among these titles, *Phantopia* hit this threshold one day after launch, while *Jelly Busters* spent 144 days to reach the same mark.
However, calculated based on the revenue from September 18 to October 17, *Jelly Busters* recorded 5.8 million US dollars, almost twice the 3.2 million US dollars of *Phantopia*.
This is not an accidental contrast between individual cases. After further breaking down the data by game genre, IP and regional markets, the figures also present more phenomena that do not fully align with common intuition: casual puzzle games take longer to reach their first 1 million US dollars in revenue, but have a higher median cumulative revenue; IP games can significantly speed up their revenue kickoff, yet they do not widen the gap in cumulative revenue by a comparable margin; while games led by the North American market take longer to hit 1 million US dollars, their long-term median cumulative revenue is higher than that of games led by the Japanese and South Korean markets.
These data point to a noteworthy question: as the mobile game market gradually matures, how exactly should we measure the commercial potential of a new game?
Earning 1 million US dollars in a single day: why is this not enough to tell the whole story?
Let's first look at the overall sample of this study.
AppMagic counted games launched between January 1 and October 13, 2026 that reached 1 million US dollars in cumulative IAP revenue before October 17, and finally included 158 products in the research (since the revenue estimate for the Chinese mainland market only covers the App Store, the study excluded 36 games that generated at least half of their revenue from the Chinese market).
Among these 158 games, the most intuitive contrast comes from the speed at which they reach their first 1 million US dollars in revenue.
*Phantopia* hit 1 million US dollars one day after launch, while *Jelly Busters* took 144 days. Judging only by this indicator, the two games seem to be at completely different commercial starting points.
However, the revenue ranking of the most recent 30 days gives a different answer. *Jelly Busters* recorded 5.8 million US dollars in revenue in the same period, and *NTE* recorded 3.2 million US dollars. Taking 143 more days to reach the first 1 million US dollars did not prevent the former from achieving higher monthly revenue in subsequent stages.
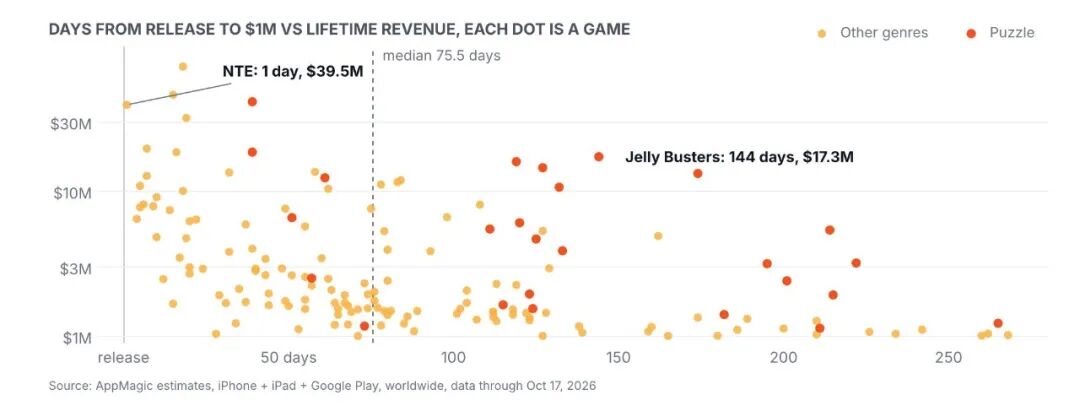
Another example is *Family Farm Merge* from Diandian Interactive. This game took 214 days to reach its first 1 million US dollars in revenue, but as of the statistical window of the original report, its revenue in the most recent 30 days had reached 2.4 million US dollars.
Of course, high monthly revenue does not necessarily mean higher cumulative revenue, nor can we conclude that slow-burn games have more potential based solely on these few cases. What they really illustrate is that: The first 1 million US dollars reflects the commercialization milestone a product reaches at a certain stage, rather than its final revenue ceiling.

Especially for games of different genres, the path to reaching the same revenue threshold can be completely different. Some games rely on concentrated marketing campaigns and high initial player spending at launch, while others need to spend longer time accumulating users, iterating gameplay, and then gradually scaling up their commercialization.
If you only look at the short-term revenue right after launch, the former type of games may be more easily identified as successful products; but if you extend the observation window, the ranking may change.
Slow-burn casual puzzle games, but earn more than RPGs?
If the comparison between *Phantopia* and *Jelly Busters* is just an individual case, the differences presented by the genre data are even more noteworthy.
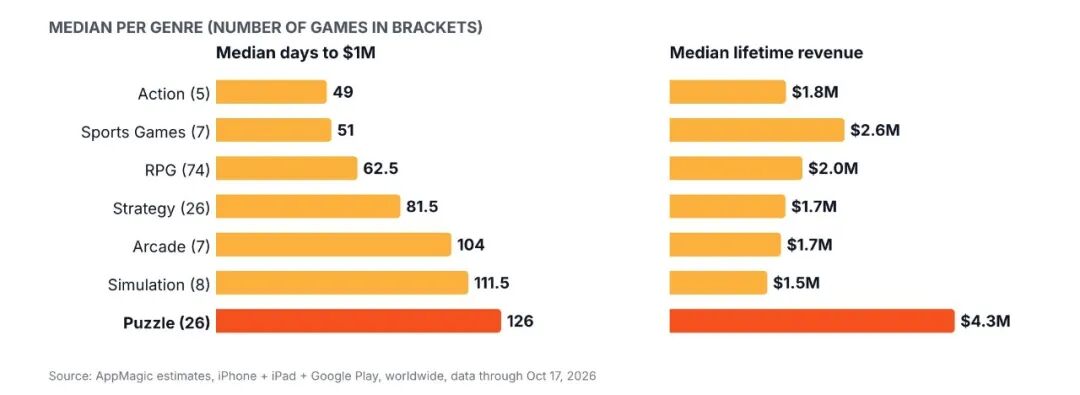
Among the casual puzzle games included in the statistics, the median time taken for 26 products to reach their first 1 million US dollars in revenue is 126 days, and none of them hit this threshold within 30 days.
In comparison, the median time for RPG games to reach their first 1 million US dollars in revenue is only 62.5 days, less than half of that of casual games.
But in terms of cumulative revenue, the situation is exactly the opposite: the median cumulative revenue of casual puzzle games reaches 4.3 million US dollars, while that of RPGs is only 2 million US dollars. In other words, casual puzzle games take roughly twice as long as RPGs to reach their first 1 million US dollars, and their median cumulative revenue within the sample is also nearly twice that of RPGs.
This may be related to the different development and publishing rhythms of the two types of games.
RPGs usually need to complete relatively complete product content before launch, and cooperate with concentrated publishing and marketing campaigns; some casual puzzle games can gradually find effective product design and customer acquisition methods through soft launch, gameplay testing and continuous iteration. However, AppMagic does not provide sufficient user acquisition and retention data to directly verify this explanation, so we cannot simply attribute the revenue difference to publishing strategies.
More interestingly, there are also obvious structural differences within the casual puzzle game category.
"2D merge" and "sorting" are the two most important sub-genres of gameplay among these products. The 9 merge games recorded a total cumulative revenue of 83.5 million US dollars, and the 8 sorting games recorded a total cumulative revenue of 77.3 million US dollars, the two sub-genres together account for about 80% of the total revenue of the 26 casual puzzle games.
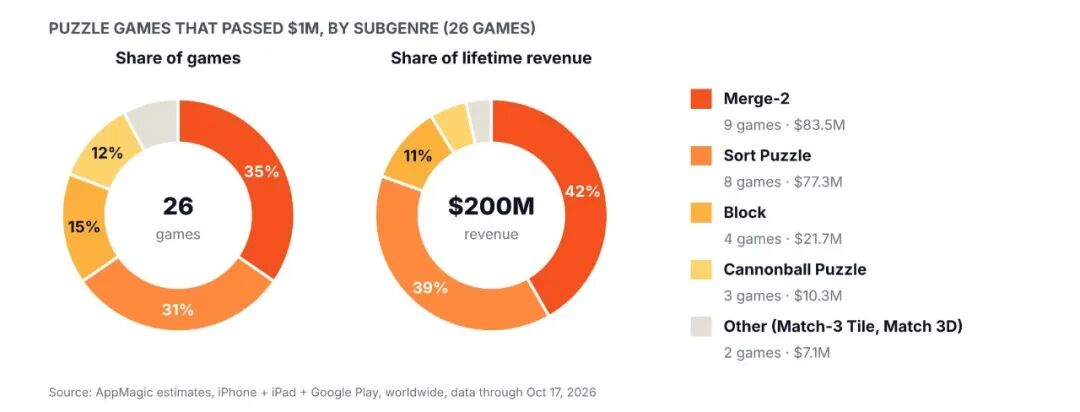
Among them, the median time for sorting games to reach their first 1 million US dollars in revenue is 127.5 days, but their median cumulative revenue has reached 11.5 million US dollars. 5 casual games including *Jelly Busters*, *Hotel Tour*, *Bus Traffic Fever!*, *Cube Land* and *Car Sort* all spent more than 90 days to reach their first 1 million US dollars, before further growing into products with cumulative revenue exceeding 10 million US dollars.
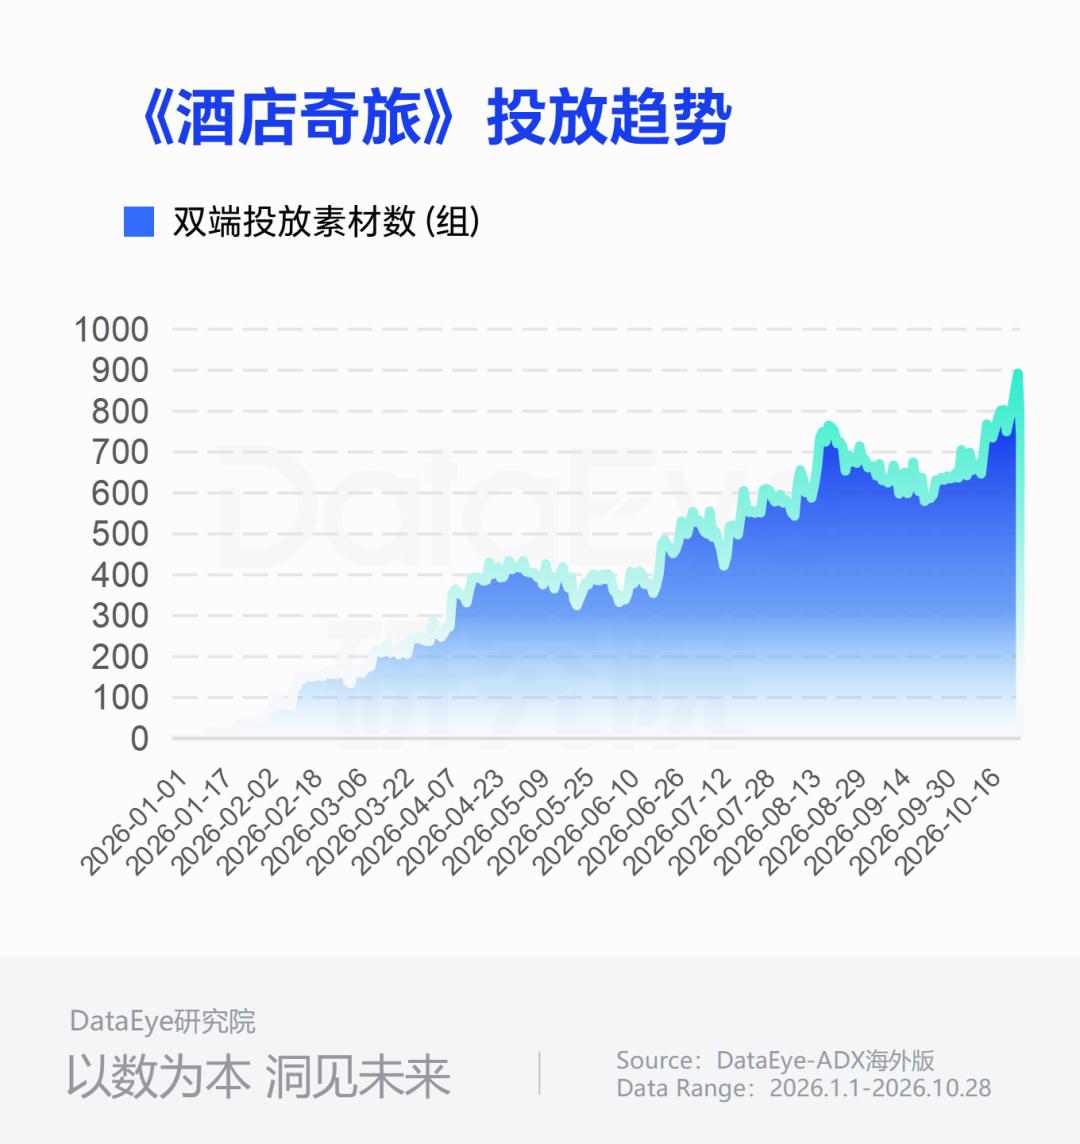
This means that the overall performance of casual games does not come from a concentrated explosion of a certain gameplay in the early post-launch stage, but a considerable part of the revenue is contributed by products that take longer to reach 1 million US dollars but perform well in subsequent revenue growth.
The *State of Gaming 2026* report from Sensor Tower also provides a larger market context: the global mobile game IAP revenue increased by 1% year-on-year to reach 82 billion US dollars in 2025, while download growth has slowed down. The report lists retention, continuous operation, in-game events and IP collaboration as increasingly important growth methods in mature markets.
The two sets of data cannot directly prove that slow-burn puzzle games are more adapted to mature markets, but they together point to a research-worthy direction: when user growth can no longer be easily driven purely by new downloads, whether a product can continuously attract users and repeatedly create reasons for them to spend money may be more worthy of attention than the revenue growth speed in the early post-launch stage.
IP allows games to make money faster, but does not necessarily determine their final revenue
If the contrast in casual games comes from the genre-specific operation rhythm, IP games present a different situation: it does help products get a faster start, but this advantage has not been fully converted into a gap in cumulative revenue.
In the statistical sample, 20 of the 42 IP games reached their first 1 million US dollars in revenue within 30 days, accounting for about 48%; among the 116 original games, only 7 achieved this, accounting for about 6%.
In terms of median figures, IP games take 35.5 days to reach their first 1 million US dollars in revenue, while original games take 83.5 days, with a gap of 48 days between the two groups.
But if we look further at cumulative revenue, the median of IP games is 2.6 million US dollars, and that of original games is 2 million US dollars, the gap is far smaller than the gap in their starting speed.
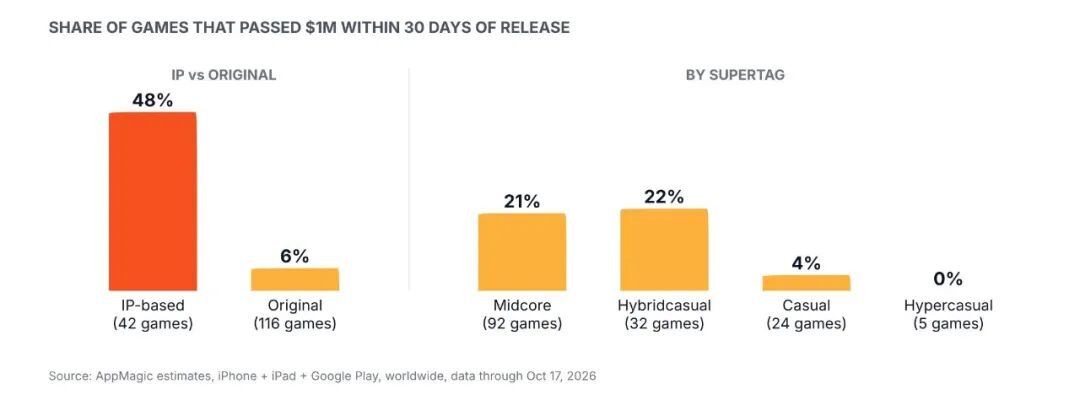
This set of data easily reminds people of the commercial value of IP: the existing fan base, character recognition and content influence can help games quickly get attention and paying users in the early publishing stage. But IP cannot automatically guarantee subsequent revenue growth, product experience, monetization design and continuous operation will still affect the performance of the game.
*hololive Dreams* is a case that performs well in both starting speed and subsequent revenue. This game reached its first 1 million US dollars in revenue within 15 days, and as of the time of the report's statistics, its cumulative revenue had reached 46.4 million US dollars.

However, there is still a key limitation here: the study only includes games that have already reached 1 million US dollars in revenue. Therefore, the 48% and 6% figures reflect the difference in the speed of reaching the threshold between the two types of successful products within the sample, rather than the overall success rate of all IP games and original games.
IP can help games get initial commercialization results faster, but to convert this advantage into long-term revenue, the product itself still needs to continuously meet user expectations.
Japanese and South Korean games have a faster start, while North American games have a higher median revenue
In addition to genre and IP, which region the revenue mainly comes from will also affect the speed at which the game reaches 1 million US dollars in revenue.
Games are grouped by the region where they generate the highest proportion of revenue. South Korea-led games have a median time of 53 days to reach their first 1 million US dollars in revenue, Japan-led games take 60 days, while North America-led games take 89 days.
At first glance, it seems that the Japanese and South Korean markets are easier to help new games achieve commercialization quickly. But if we continue to observe the cumulative revenue, North America-led games show different characteristics.
The median cumulative revenue of North America-led games is 3.5 million US dollars, higher than the 2.9 million US dollars of Japan-led games and the 2.3 million US dollars of South Korea-led games.
In other words, North America-led games take longer to reach their first 1 million US dollars in revenue, but among these products that have successfully broken through 1 million US dollars, their median cumulative revenue is even higher.
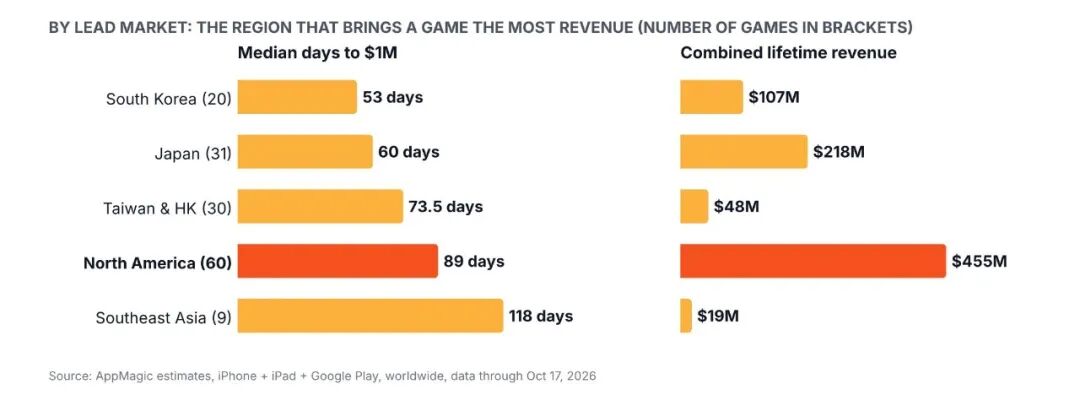
This does not mean that the North American market is inherently more conducive to long-term growth. AppMagic's data also shows that RPGs account for 69% of Japan and South Korea-led games, while casual puzzle games account for 38% of North America-led games. The product form, monetization mechanism and publishing rhythm of different game genres are very likely to affect the comparison results across regions.
It is worth noting that the revenue sources of North America-led games are more scattered, with about 48% of their median revenue coming from the local North American market; Japan and South Korea-led games tend to rely more on their respective core markets.
Therefore, this set of data is more suitable to illustrate that: There is not only one path to reach 1 million US dollars in revenue. Focusing on operating a high-value market and accumulating revenue across multiple markets can both lead to commercialization results. But without further controlling variables such as genre, IP and user acquisition scale, we cannot judge which path is better solely based on these data.
After the first 1 million US dollars, comes the further test of the product's growth capability
If AppMagic's study reveals the revenue starting lines of different games, a new study on the first-year monetization of new games from Moloco further demonstrates how the revenue structure changes after launch.
Moloco tracked 55 mobile game publishing projects it supported, with the sample covering more than 20 million paying players and 1.5 billion US dollars in IAP revenue, mainly observing the spending behavior of US users within 12 months after the game's launch.
The study found that the paying user value of different types of games will not be completely finalized at launch.
For games that rely on a small number of high-paying players, the average revenue per paying user (ARPPU) at the end of the first year is 250% higher than that in the first month; for games that generate revenue from a broader group of paying users, this